
|
Kevin Smith, of Delft Partners and Portfolio Manager of the TAMIM Asia Small Companies fund, examines the misconceptions surrounding China. For such an important player in the world economy it is wildly misunderstood by the average westerner. I have observed economic developments in China during the past three decades and found myself very frustrated with the ways in which China is often portrayed in the media. One of the best explanations of our fundamental misunderstanding of China is provided by former World Bank representative in China and Russia, Dr Yukon Huang in his book called “Cracking the China Conundrum Why Conventional Wisdom Is Wrong”. Key points raised by Dr Huang are that China:
For the past decade China has received a lot of negative comments around the “unbalanced” nature of growth, the familiar theme is not enough consumption and too much investment, the consumption share of GDP of 35% is “too low” and investment at 45% of GDP is “too high”. The United States has been quick to blame the structure of China’s growth for their own trade deficit problems and prescribed a policy response that fails to understand just where China is on the development path. That development path was followed by various Asian countries to great success, Japan from 1950, Taiwan from 1953, South Korea from 1964 and Singapore from 1965. It is very instructive to compare the growth, consumption and investment numbers from China from 1985 with Japan, Taiwan, South Korea and Singapore from those various starting dates. The results are shown on the following charts showing average growth rates over the periods up to 25 years, then 25 to 35 years and finally 35-45 years (excluding China). The numbers are remarkably similar, all of these countries achieved growth rates approaching double digits in those first 25 years driven by rapid growth in the investment share of GDP and a fall in the consumption share of GDP. GDP growth rates from various starting points: China* versus selected Asian countries 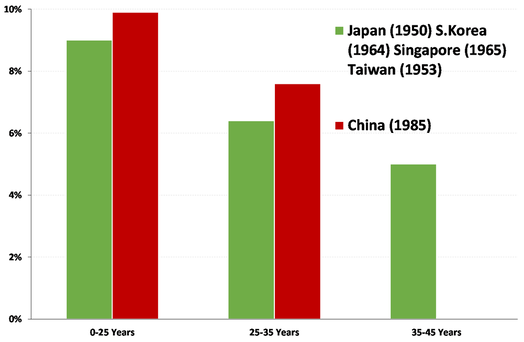 Source: Penn World Tables | *China has not recorded data for the 35-45 years period Consumption growth rates from various starting points: China* versus selected Asian countries 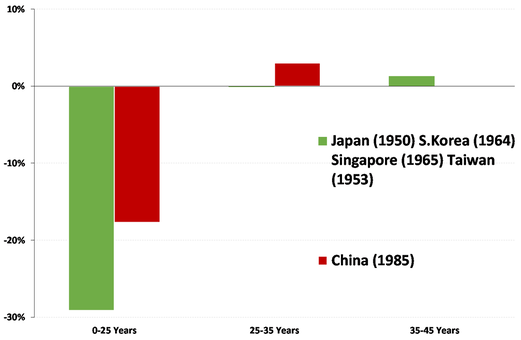 Source: Penn World Tables | *China has not recorded data for the 35-45 years period Investment growth rates from various starting points: China* versus selected Asian countries 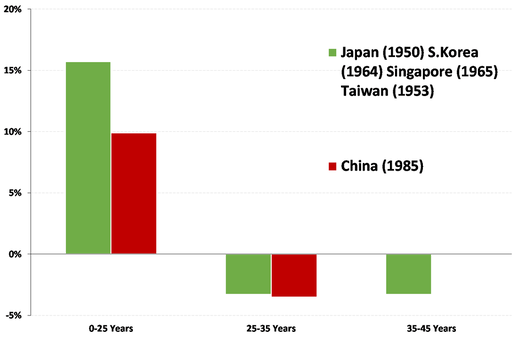 Source: Penn World Tables | *China has not recorded data for the 35-45 years period These charts provide a much better context to understand China, is following a development path that will ultimately result in a rising consumption share to GDP, however, this doesn’t mean that consumption in China hasn’t been rising, it has been rising very rapidly in aggregate terms, just about as fast as any country could achieve. The simple explanation for the growth in consumption and the fall in consumption share of GDP is the process of urbanisation, workers moving for agricultural to urban locations see a dramatic rise in incomes which allows for both rising consumption and rising savings (hence growth in investment). In the period since economic reforms started, the urban population of China has grown from 18% of the total to 58% and is heading towards 70% in the next two decades. Annual migration from rural to urban areas is continuing at the rate of 20-25 million people per annum. The rural population of China peaked at 860 million in 1995 and is now 570 million. Total Consumer Spending in China, RMB millions 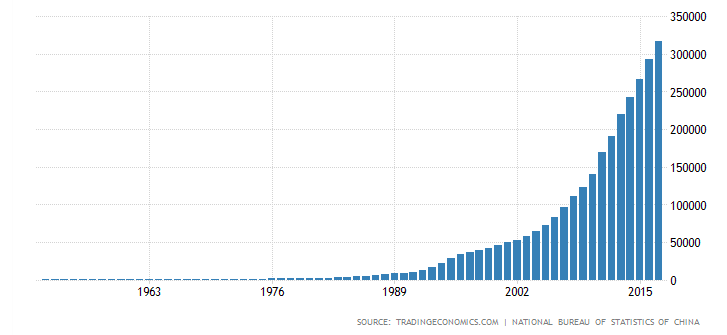 There are two other widespread misconceptions about China, the debt problem and the “property bubble”, Dr Huang provides a rational explanation for each of these issues, demonstrating that they are not as problematic as expressed in the media reporting. Starting with debt, yes, China has a large stock of debt see breakdown below, but when you run a comparison with other countries, it sits mid-table, more than is typical for an emerging economy and less than is typical for developed economies. This is what you would expect from an economy like China which is not an emerging market and not yet a developed market. China occupies the middle ground for developed vs. emerging countries in total debt 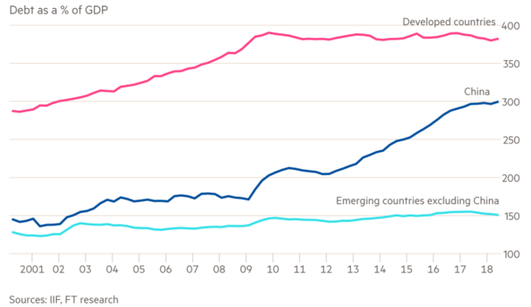 The main problem areas for debt in China are state-owned enterprises (SOEs) borrowing from state-owned banks, this is a large part of the red shaded area on the chart that follows. For decades, state-owned enterprises have under-performed the private sector in China and absorbed massive resources, achieving very poor rates of return dragging down the overall economic performance of China. 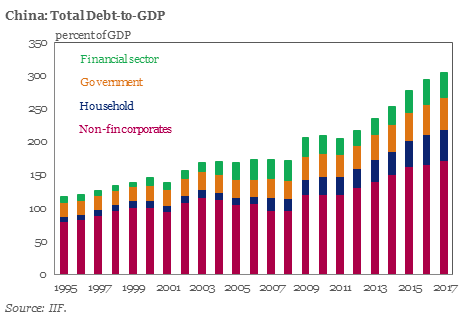 The following chart shows the return on assets achieved by the state (and mixed) sector to be around 4% and well below the double digit returns that are achieved in the private sector. The key problem for SOEs is recognition of bankruptcy, some 30% of SOEs are persistently loss making and should have been closed down. Only in the past two years have bankruptcies been allowed to occur in China on a scale that will start to have a positive impact on the overall economy. Return on Assets for Private, State-Owned Enterprises and Mixed Ownership Firms in China 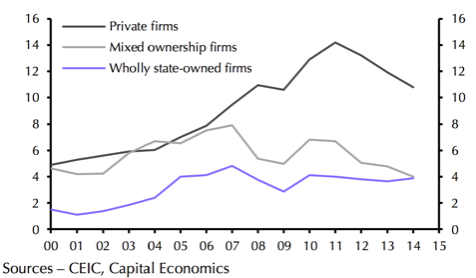 In 1999-2000 non-performing loans were officially 30% of the loan books of state-owned banks, in reality that number was nearer to 50%. Today non-performing at “at-risk” loans account for 5% of loan books and a more realistic number is nearer to 10-15%, so nothing like as bad as the crisis of twenty years ago. One good aspect of state-owned enterprises owing debts to state owned banks is that it is an entirely domestic transaction, the write-offs that will be required don’t have an international impact. The state-owned banks are very conservative banks in the international context, gearing rates are less than half of the levels tolerated in the United States or Europe. A combination of SOE debt being written off and some adjustment to state owned banks levels of gearing will see China able to navigate through this episode of the debt problem without a crisis. The property market in China has seen a three to four-fold increase in land values during the past decade and the immediate response is to assume that this a “property bubble”. Dr Huang argues that the dramatic increase in land/property values must be observed in the context that privately owned property didn’t exist in China two decades ago and this transition from state owned to privately owned property assets isn’t a “bubble” of the type we have seen in Western economies in recent years. Rather than worry about the pace of increase, Dr Huang argues that we have forgotten that land values in China are typically lower than that of India, a country which has always recognised private ownership of land. China is at a much earlier stage of development when it comes to establishing a market value for land and property. Within the past generation, land has gone from having zero commercial value to an attempt to establish market prices, this process is a demonstration of “financial deepening” not a “bubble” and should be viewed as a positive not a negative. The simple act of changing the designated use of land can change value by five, ten or even twenty times the original level. While a major city like Shanghai has reached top tier international price levels for land and property, the price gradient for the majority of other cities in China is very steep. Taking the city of Xi’an in the North Western interior of China, residential land prices stand at just 21% of the average levels in Shanghai and while it is unlikely that Xi’an will ever reach the heights of prices in Shanghai, the 4.6:1 pricing difference will narrow over time. In the period out to the year 2035, the city of Xi’an is forecast to experience population growth from the current level of 7.2 million to 10.4 million and population growth will be a key factor in determining the price of land in that city. This trend will be replicated across dozens of cities in the interior of China during the next two decades as the process of urbanisation and “financial deepening” is completed. Comparison of Property Prices in Shanghai and Xi’an 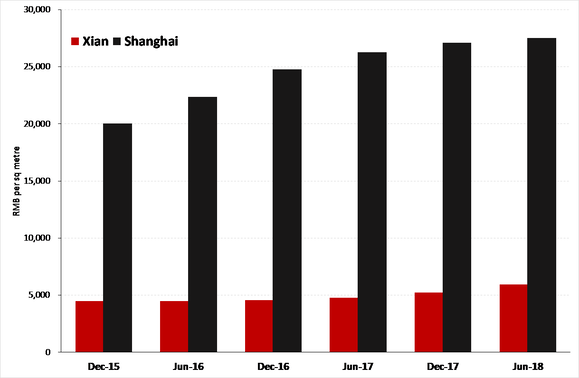 In conclusion, this article highlights some of the ways in which China is misunderstood, Dr Huang has demonstrated that China is following a growth path similar to Japan, South Korea, Taiwan and Singapore from the 1950s and 1960s. Criticisms of Chinese levels of domestic consumption are unfounded and fail to account for the process of urbanisation that is far from complete. When it comes to debt in China, the numbers are consistent with the current stage of development for a country that is not emerging or developed but a mixture of the two. Better management of SOEs especially allowing bankruptcies and debts to be written off from the books of state owned banks will give a much clearer picture of the true nature of the debt burden in China which is both sensible and manageable. Finally, the property market in China is not a “bubble” but an example “financial deepening” with strong underlying demand generated by urbanisation and the rapid development of market prices for land assets that in the past were wholly owned by the State.
0 Comments
Your comment will be posted after it is approved.
Leave a Reply. |
Markets & CommentaryAt TAMIM we are committed to educating investors on how best to manage their retirement futures. Sign up to receive our weekly newsletter:
TAMIM Asset Management provides general information to help you understand our investment approach. Any financial information we provide is not advice, has not considered your personal circumstances and may not be suitable for you.
Archives
April 2024
Categories
All
|
 RSS Feed
TAMIM | Equities | Property | Credit
DISCLAIMER
The information provided on this website should not be considered financial or investment advice and is general information intended only for wholesale clients ( as defined in the Corporations Act). If you are not a wholesale client, you should exit the website. The content has been prepared without taking into account your personal objectives, financial situations or needs. You should seek personal financial advice before making any financial or investment decisions. Where the website refers to a particular financial product, you should obtain a copy of the relevant product services guide or offer document for wholesale investors before making any decision in relation to the product. Investment returns are not guaranteed as all investments carry some risk. The value of an investment may rise or fall with the changes in the market. Past performance is no guarantee of future performance. This statement relates to any claims made regarding past performance of any Tamim (or associated companies) products. Tamim does not guarantee the accuracy of any information in this website, including information provided by third parties. Information can change without notice and Tamim will endeavour to update this website as soon as practicable after changes. Tamim Funds Management Pty Limited and CTSP Funds Management Pty Ltd trading as Tamim Asset Management and its related entities do not accept responsibility for any inaccuracy or any actions taken in reliance upon this advice. All information provided on this website is correct at the time of writing and is subject to change due to changes in legislation. Please contact Tamim if you wish to confirm the currency of any information on the website.
magellen, kosec, clime, wilson, wam, montgomery, platinum, commsec, caledonia, pengana, tamim