
|
Heading into a new financial year, Guy Carson takes a look at the state of the Australian economy and provides his expert views on what to expect going forward.
To understand our view, it is important to look at recent trends. Despite the fact that Australian GDP recorded a solid result last quarter, the story of the last ten years has been one of slowing economic growth and an increasing reliance on population growth and immigration. Over the last ten years, real GDP has averaged 2.5% whilst per capita GDP has grown just 0.9% per annum. 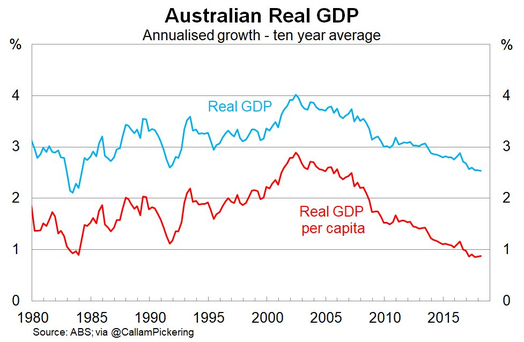 Low GDP per capita growth suggests that while the economy is growing in size, households are not getting richer. The wage data also backs up this point with consistent weakness since 2012. With slowing wage growth, households were pushed into more debt via interest rate cuts from the Reserve Bank of Australia (RBA) and the overall result is a vulnerable consumer. The below graphic from the RBA shows the contribution of all the components of GDP for the March quarter. The vulnerable consumer was there to be seen in with Household Final Consumption Expenditure (HFCE) growing at just 0.3% for the quarter and adding just 0.2% to GDP. In addition, the household savings ratio continued to fall, hitting its lowest level since December 2007.  Source: ABS Whilst all components were positive, the largest contribution (equivalent to half the overall growth) came from net exports. We may be stating the obvious but Chinese demand for commodities has been a key driver of the Australian economy in recent times. The implication from this is that where China goes, typically Australia will follow. Commodity prices and mining companies have experienced a renaissance since early 2016. The question is whether this will continue? For the answer to that we need to look at credit. In 2008 a Deutsche Bank economist named Michael Biggs introduced the term “Credit Impulse” to the world. Credit Impulse was defined as the change in new credit issued as a percentage of GDP. His work showed that in a highly leveraged world (which is what we live in) changes in credit were a key component of consumption and investment. A household or a business’s ability to spend is equal to its income plus how much debt it takes on (or pays off). Hence, change in debt is a critical swing factor. In China, credit is primarily held at the corporate level , this is different to the developed world which saw significant increases in household debt leading up to 2008. China’s credit impulse has been a key driver of global economic growth in recent times. Back in 2009, it surged on the back of fiscal stimulus. This led to a huge surge in commodity demand and the start of the 2009-2012 mining construction boom in Australia. Since 2009, the impulse has had had two bounces on the back of mini-stimulus packages. Firstly in 2012 and then more recently in late 2015 which lasted through 2016. This last surge was in our opinion the key driver behind the so-called “co-ordinated global growth” we have heard so much about in recent times. Interestingly the low in between the two periods above was met with falling commodity prices and a genuine mining bust. In early 2016, the share price of BHP stood around $15 and RIO fell below $40. 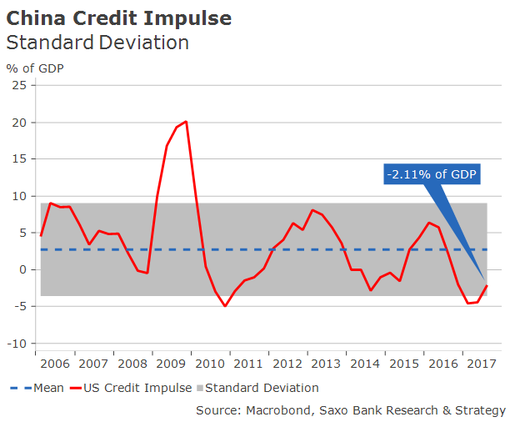 The recent 2015/16 stimulus package stopped the bleeding for the miners and has led to a slight renaissance. Recently both BHP and RIO have committed to replacement Iron Ore projects which will be a positive for the Western Australian economy. In addition, Lithium saw a significant construction boom kick off, however that appears to be unravelling with Lithium benchmark prices down over 25% year to date. Whilst the electric car has a bright future, the increase in supply we have seen (and will continue to see) has pushed the lithium market into oversupply. Lower prices and lower investment will be the cure. Importantly for miners and for Australia, the Chinese credit impulse above appears to have approximately a one year lag. In fact the below chart (slightly out of date as it doesn’t include the most recent GDP reading) shows a significant correlation between the Chinese Credit Impulse and Australian GDP. Where China goes, Australia typically follows. 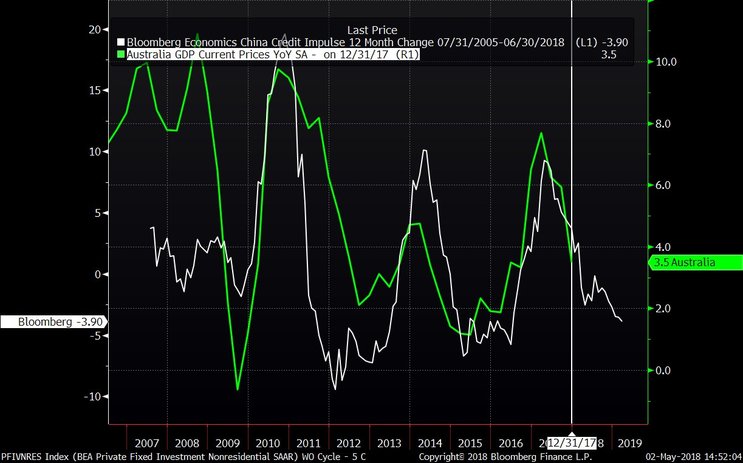 Source: Bloomberg, https://twitter.com/jp__ob The key reason China is so important for Australia is trade. China is by far and away Australia’s largest trading partner and is the key customer for all our mineral exports. China consumes a significant proportion of the world’s raw materials. In fact, in most metals and bulk commodities it consumes over 40%. The notable exception being Oil and Gas. 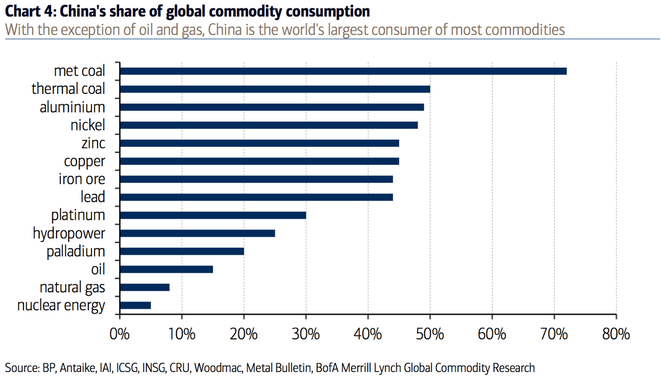 When the Chinese credit impulse turns negative we start to see Fixed Asset Investment growth fall. We saw a significant decline in 2014 and 2015 which drove Central Authorities back to fiscal stimulus and a stabilisation across 2016 and 2017. We are just to starting to see further falls now and this is something we will be watching closely. Interestingly, Steel production growth has not yet started to fall and that is something we would expect to see later this year. Offsetting the weakness has been some monetary loosening with the Peoples Bank of China reducing interest rates recently. 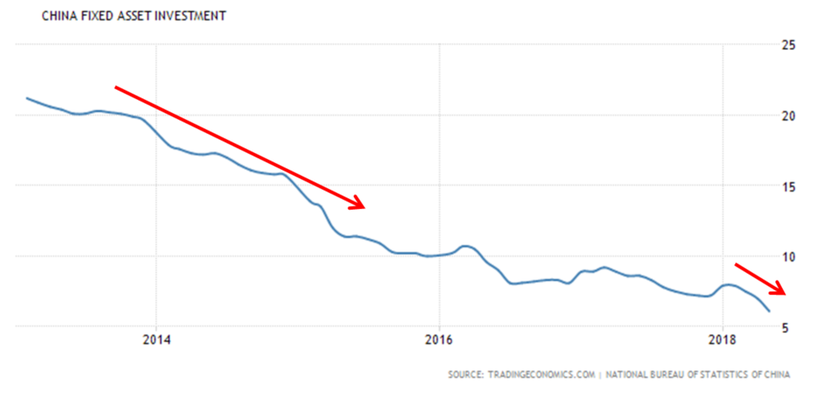 Source: tradingeconomics.com The good news for the Australian economy is that the fallout this time is likely to have less of an impact on the economy and on unemployment (relative to last time). The reason behind this is the bulk of the mining construction boom has been unwound. The below chart looks at construction work done on a national basis and the engineering construction line (largely mining) has gone back roughly to where it was in 2009, i.e. prior to the boom. Whilst the miners have enjoyed better prices over the last 18 months or so, the shock of 2014-15 has led to more conservative capital management. 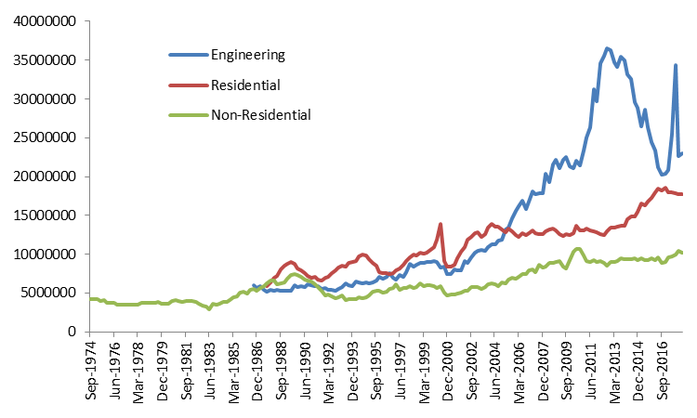 Source: ABS This chart brings us to the other major driver in the Australian economy, the residential property market. As you can see from the red line above, residential construction started to rise in 2012. In cutting interest rates the RBA basically replaced a mining boom with a residential boom. This is very similar to the Federal Reserve in the US in the early 2000s when they replaced a tech boom with a residential boom. The problem the RBA has is that the red line has started to come off and this is cause for concern. We have written extensively in the past about a 2007 paper written by US Economist Edward E. Leemer called “Housing IS the Business Cycle”. In this paper, Leemer looks at all the recessions in the United States since World War 2 and finds that 8 out of the 10 were “preceded by substantial problems in housing and consumer durables.” This leads him to conclude that “Housing is the most important sector in our economic recessions, and any attempt to control the business cycle needs to focus especially on residential investment.” The only two US recessions that are exceptions to the above were the end of the Korean War in 1953, caused by a decline in defence spending, and the 2001 “Tech Wreck”. As the paper was written in 2007, we can now improve the success ratio to 9 out of the last 11 recessions following the 2008 recession, something that Leemer warned about. The key reason Leemer gives for housing being so important to the economy is that “house prices are very inflexible downward, and when demand softens as it has in 2005 and 2006, we get very little price adjustment but a huge volume drop. For GDP and for employment, it’s the volume that matters." In other words, a housing cycle will typically see a drop in transaction volumes and building activity that will lead to job losses and ultimately a downturn in the economy. In Australia, construction (along with healthcare) was the two key drivers of the record jobs gains last year. Construction employment is now at its highest level in a century (9.6% of labour force) and, according to the RBA, residential construction accounts for c. 75% of all construction jobs. The implications of a stagnating or falling residential market are therefore serious. The chart below shows the rise of construction jobs in recent times. One thing to note is the last time Australia had a recession, the number of construction jobs fell by 17%. 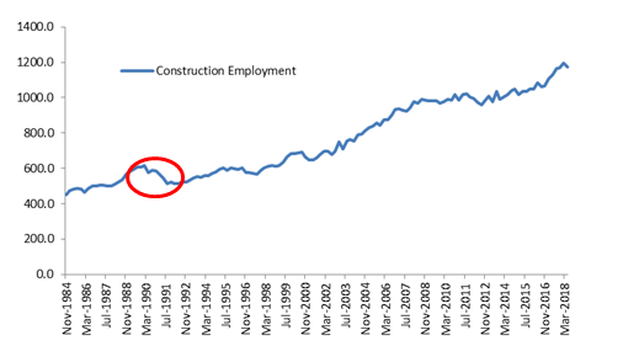 Source: ABS The recent falls in residential construction have not been broad-based. They have been driven by Western Australia and Queensland whilst New South Wales and Victoria have flat lined. 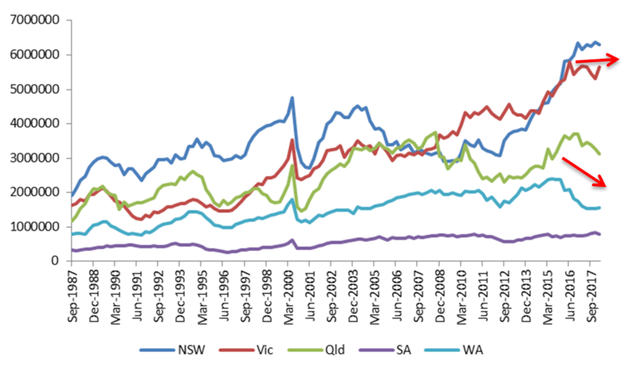 Source: ABS Perth/Western Australia has arguably hit rock bottom whilst Queensland’s shock is set to continue. The construction boom nationally has been driven by Apartments and the below chart from the RBA shows the increase in stock across the four major capital cities. Brisbane’s apartment boom relative to its size is extraordinary. It added 12% to its existing unit stock last year and will add more this year. That is an increase in stock of over 25% across 2 years. 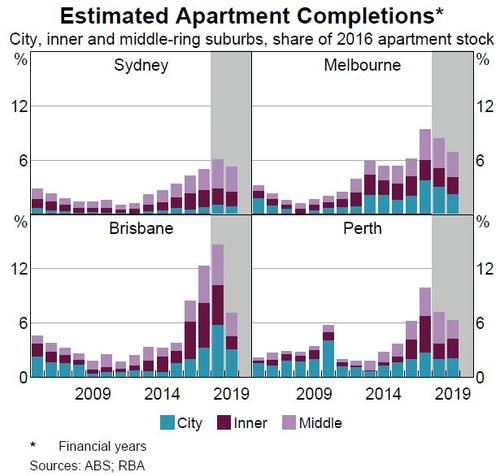 The cracks are now starting to appear as an oversupply of apartments hits the city. Over the last three months, 38.9% of the units sold in Brisbane were sold below their previous purchase price. 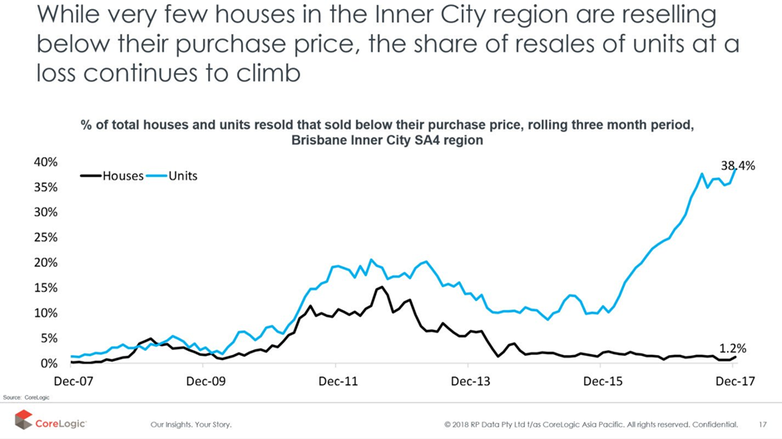 Source: CoreLogic In addition, all areas of Brisbane have seen significant falls in apartment prices from the previous market peak (2008). The inner city has held up well but significant supply is set to hit the market later this year. 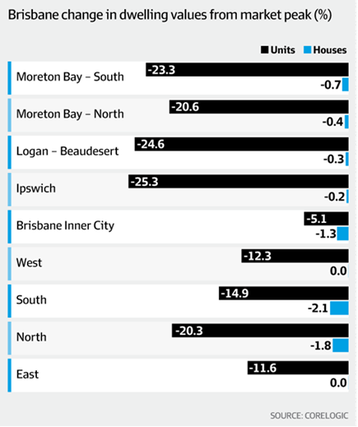 Source: CoreLogic, AFR The result of this oversupply is a potentially a sharp fall in construction followed by a prolonged period of lower activity. The real risk though lies outside of Queensland. The major impact so far of the Royal Commission has been tighter credit as the banks have been forced to follow lending standards that they were always meant to. A restriction to the supply of credit ultimately means a fall in demand for housing. In fact the amount people can borrow is the key factor in housing demand. We are starting to see evidence of this on a national basis. The most constant data point we get to determine the demand for housing is the Auction results every Saturday. From 2013 to 2017 we got strong results with Melbourne and Sydney often hitting 80% plus. Now in Sydney we are starting to see sub 50% rates on significantly lower volumes. 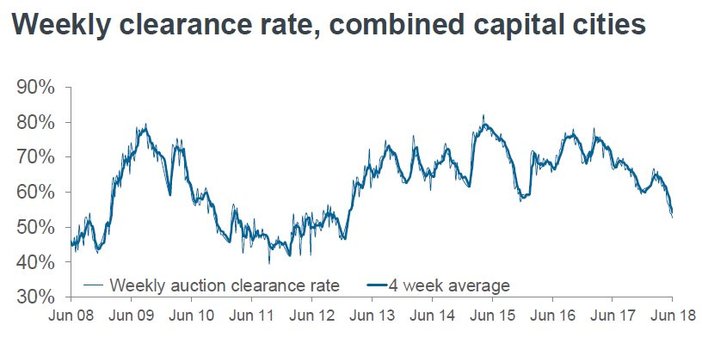 Source: Business Insider Over the past six years we have got used to the RBA stepping in if the property market showed signs of slowing. This may have changed now as Governor Phil Lowe has made it clear in recent speeches that they won’t step in just to stop housing market weakness. Conclusions With a slowing China and a slowing property market, downside pressures are building for the Australian economy. Within our portfolio, we have limited exposure to domestic cyclicals. The only area where we see significant tailwinds over the next few years is infrastructure construction. One of the ways to escape the challenges that the Australian economy faces is to own companies that make money globally. Over the last 18 months our portfolio has benefited significantly from owning high quality global businesses. However a number of these companies are looking fully valued or outright expensive. The chart below shows the rerating of the CSL share price over recent years from a company that traded on a P/E multiple in the low 20s to one that trades close to 34x. 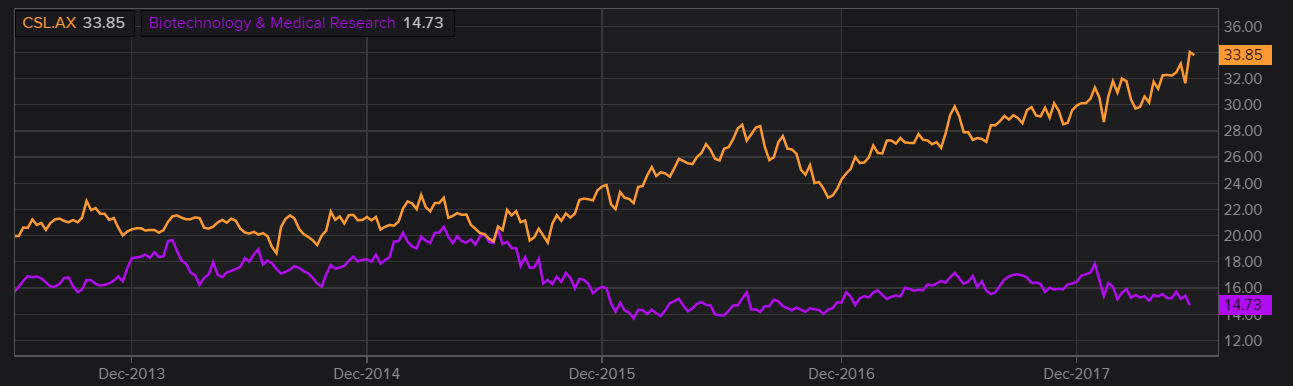 Source: Thomson Reuters Elsewhere in the midcap space, high quality growth companies have been bid up to ludicrous levels. Altium currently trades at 48.4x (we first purchased it back in 2015 on 22x and no longer hold it) and Wisetech Global trades at a ridiculous 86.2x.
We have over the last six months been rotating out of the midcaps to smaller niche players where valuations are reasonable but earnings risk is a higher. The result is a portfolio with more positions that are smaller in size and conviction as well as an elevated cash level.
1 Comment
Michael G Hayter
28/6/2018 08:30:34 pm
Not much good news, but thanks for an excellent article. Your comment will be posted after it is approved.
Leave a Reply. |
Markets & CommentaryAt TAMIM we are committed to educating investors on how best to manage their retirement futures. Sign up to receive our weekly newsletter:
TAMIM Asset Management provides general information to help you understand our investment approach. Any financial information we provide is not advice, has not considered your personal circumstances and may not be suitable for you.
Archives
April 2024
Categories
All
|
 RSS Feed
TAMIM | Equities | Property | Credit
DISCLAIMER
The information provided on this website should not be considered financial or investment advice and is general information intended only for wholesale clients ( as defined in the Corporations Act). If you are not a wholesale client, you should exit the website. The content has been prepared without taking into account your personal objectives, financial situations or needs. You should seek personal financial advice before making any financial or investment decisions. Where the website refers to a particular financial product, you should obtain a copy of the relevant product services guide or offer document for wholesale investors before making any decision in relation to the product. Investment returns are not guaranteed as all investments carry some risk. The value of an investment may rise or fall with the changes in the market. Past performance is no guarantee of future performance. This statement relates to any claims made regarding past performance of any Tamim (or associated companies) products. Tamim does not guarantee the accuracy of any information in this website, including information provided by third parties. Information can change without notice and Tamim will endeavour to update this website as soon as practicable after changes. Tamim Funds Management Pty Limited and CTSP Funds Management Pty Ltd trading as Tamim Asset Management and its related entities do not accept responsibility for any inaccuracy or any actions taken in reliance upon this advice. All information provided on this website is correct at the time of writing and is subject to change due to changes in legislation. Please contact Tamim if you wish to confirm the currency of any information on the website.
magellen, kosec, clime, wilson, wam, montgomery, platinum, commsec, caledonia, pengana, tamim