
|
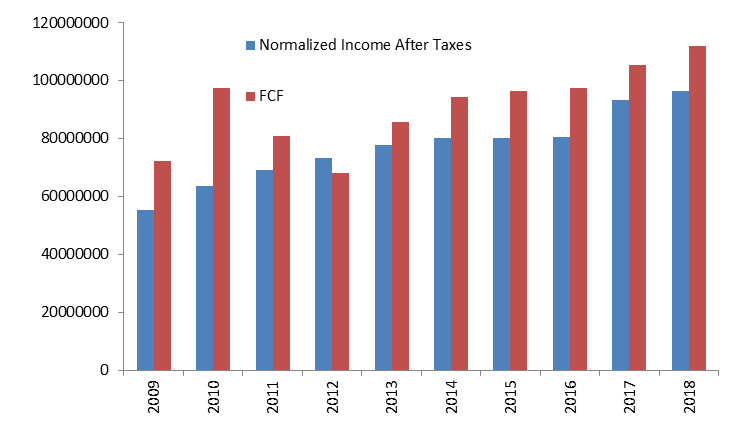
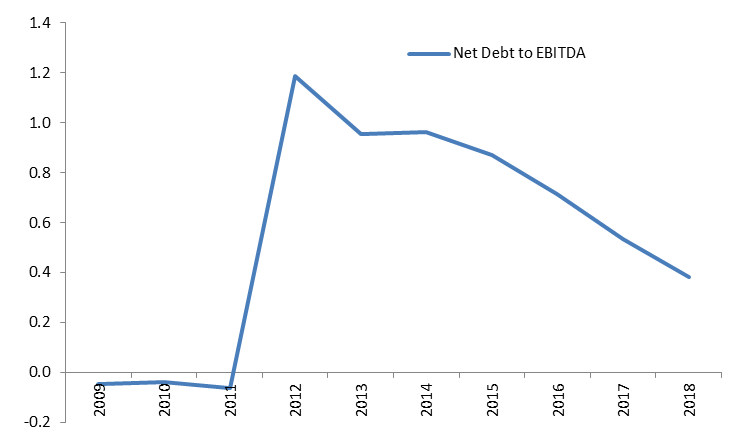
Guy Carson looks to the past in examining what is happening with valuations in the tech sector. Have we seen this before? Reporting season has come and gone and as always there were surprises. To us the major surprise was the continued march higher of stocks we considered to be significantly overvalued. Investors continue to pay up for growth in a manner akin to the late 1990s and in many cases we believe that they are ignoring history in doing so. The reality is that the Global Financial Crisis is still fresh in everyone’s mind and the problems that occurred were not valuation issues but more financial engineering. It is almost 20 years since we had a valuation issue and as a result people have forgotten. With that in mind we believe the selloff we have seen over the last week or so is just the beginning. Take CSL for example, in our opinion the highest quality company listed in Australia. It is a dominant player in the blood plasma space and has successfully turned around a loss making vaccine business. The future in an operational sense looks bright and the market is rewarding the company for its recent performance. There is a common school of thought in the market that CSL is always expensive. However it is now even more expensive than usual. In fact the valuation on a P/E basis is now the most expensive it’s been since 2002. From 2009 through to 2016, the company traded between 18-25x before breaking out. It now trades at a rather expensive 37.3 times next year’s earnings (see the blue line below). 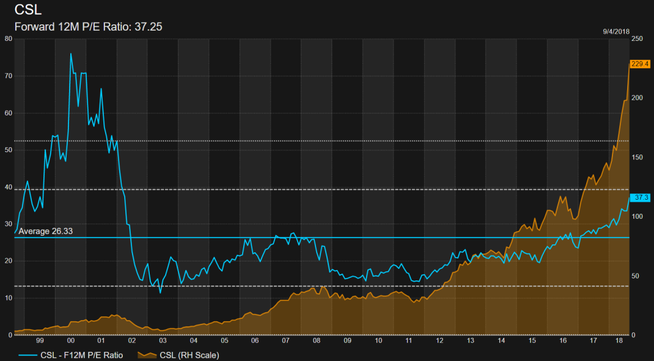 Source: Thomson Reuters Of course, a one year forward P/E is not the be all and end all when it comes to valuing companies. There are many factors at play here. In the case of CSL, a significant part of the rally has been the tremendous turnaround that the company has achieved with the Novartis acquisition. We bought CSL back in 2016 below $100 because of market concerns around that particular acquisition. If the company can replicate that success elsewhere then the current valuation may be justified. The chart below shows a significant step up in earnings last year on the back of the turnaround. The big step up is unlikely to be replicated and the company’s guidance in the recent result was below consensus expectations. Despite this, the shares actually rallied. 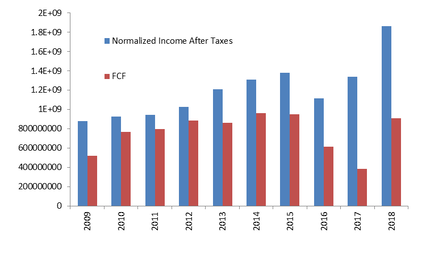 Source: Thomson Reuters, company filings The major issue we have the market currently is the pattern of CSL's P/E is not just confined to CSL. Below is the same chart for Cochlear and we see the same pattern. The P/E traded in a range until 2016/17 and has broken out. Cochlear shares are now the most expensive they have been since 2002. Again similar to CSL, Cochlear is a high quality global leader in a defensive industry but we are not sure that the current multiple of 45x is justified by its earnings per share growth of 11.3% over the last 10 years. 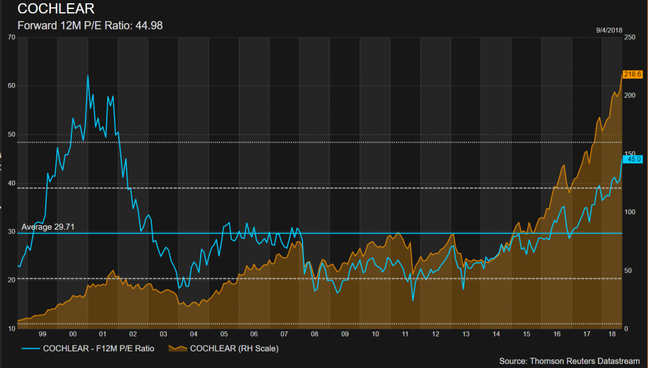 Source: Thomson Reuters And Resmed shows a similar pattern as well (although to slightly less of a degree). 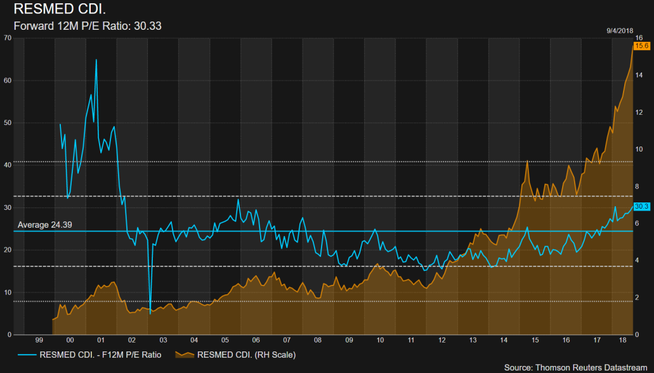 Source: Thomson Reuters We have focused on Healthcare sector because the three companies above have a long listed history that we can compare to. However, the increase of multiples in the healthcare sector is dwarfed by what has happened in the Technology sector. Take Altium for example, a company that only became consistently profitable in 2012. The company has executed flawlessly since then and has been rewarded by a multiple that has gone up to 50x. 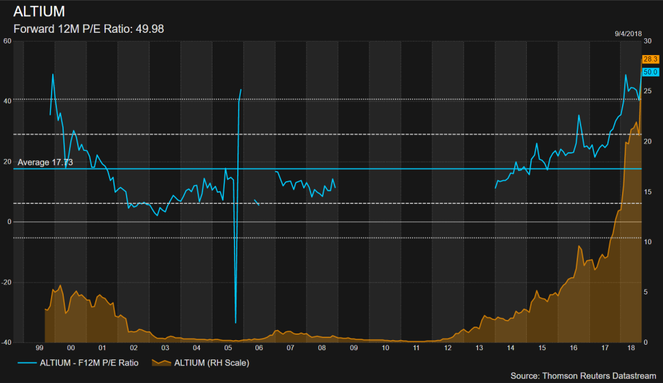 Source: Thomson Reuters In fact the whole Software as a Service (“SaaS”) has exploded. Investors are attracted to recurring revenue, high returns on capital (due to low capital requirements) and potential for global growth. We too were attracted to these aspects a few years ago and had a significant amount of capital allocated in the space. However, as valuations have risen we have realised profits and exited positions. The reality is that the re-rating in Technology (and healthcare) stocks signals to us that a majority of market participants believe that “this time is different”. When we look at ASX listed companies today, it is hard to find value. 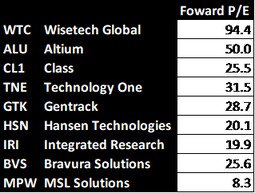 Source: Thomson Reuters Source: Thomson Reuters In fact from this list , one name stands out to us – MSL Solutions. MSL Solutions (+13.2% in August) is in our opinion the cheapest SaaS Company listed on the ASX. The company reported NPATA excluding one-off expenses and revenue of $4.6m on a market capitalisation of sub $50m. The company is a global software player in the growing and fragmented market of sports, leisure and hospitality. Over recent years the company has grown significantly both organically and via acquisition. Revenue grew by 44% in FY18 with 20% coming via organic growth and 24% via acquisitions. The company completed two further acquisitions during the year and has indicated they have several advanced opportunities in late stage discussions currently. Importantly, during FY18 recurring revenue grew 31% and now equates to 47% of total revenue. The below breakdown of the company’s revenue growth over its short listed history tells an impressive story. 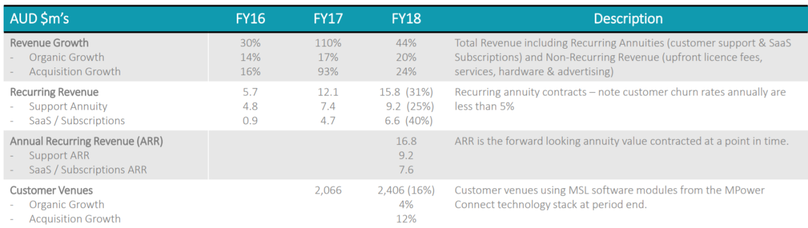 Source: MSL company filings So why are the shares trading on such a low multiple? In our opinion it is because the company has struggled with the transition to listed life. In its prospectus, the company set very high expectations for its first full year as a listed entity (FY18). Six months ago, it was fairly clear it was going to miss these expectations. It tried some financial gymnastics by selling part of its minority stake in another company called Zuuse but at the end of the day, management realised it was best to be transparent and to report the numbers in an appropriate manner. The result was NPATA of $4.6m versus prospectus forecasts of $5.9m. The miss was twofold; firstly the company had $1.5m worth of revenue slip into FY19 so revenue came in at $33.6m compared to $35.5m and secondly the company invested an additional $1.4m in expansion, most notably opening a new office in Dubai. The other concern the market has is that Free Cash Flow did not match NPATA. Over time these two should align. The major reason Free Cash Flow lagged last year was the company booked $12m of project revenue in the 2nd half and $8m of that in the fourth quarter. The company has $3m of receivables outstanding relating to that work. In addition to that $3m, there were some IPO costs paid for during the FY18 year. So whilst there are concerns around the company, we think they will start to disappear as the market starts to let the prospectus forecasts go and focuses on the business itself. Operational momentum is strong and the company has a four year growth plan where it expects to continue to grow revenue in line with historic rates (15%+). It has a target of having a customer base of over 5,000 by the end of that four year period (currently 2,406). Included in its current customer base are stadiums such as Wembley and the MCG, so it has a proven product. Economies of scale mean margins should increase as well with the company targeting a NPATA margin near 30% over the medium term (currently 13.8%). The opportunities in front of the company are large. They operate in over 25 countries but have less than 5% of their addressable market with no clear number one player. They have a net cash balance sheet and are spending heavily on research and development to improve their products (currently 17% of revenue, entirely expensed). 50% of the revenue comes from offshore and this is only likely to increase as we move forward. The company has a strong base and the chance to be a global leader in a niche field. Another Technology related company we own that saw a significant rerating was Trade Me. Trade Me (+10.6% in August) reported a result largely in line with our expectations. The company had sold down last year on fears of competition from Amazon and an increased level of investment within the business. In our opinion the step up in investment in the last financial year was unlikely to be repeated in FY19. This opinion was proven correct with the guidance given for next year showing an acceleration in profit growth on the back of lower expense growth. In addition to the solid guidance the company announced a significant special dividend (NZ$0.22 per share) in addition to its already solid yield. Since being spun out of Fairfax the company has steadily grown profits and paid down debt. They have got to the point where they believe their balance sheet is “lazy” enough (with net debt to EBITDA at 0.4x) and they can return some capital to shareholders.
Source: Thomson Reuters, TME company filings We expect this to be a trend in the future, as the company generates excess cash it will be continually returned to shareholders. Whilst it may not repeat every year, we don’t expect this special dividend to be a one off. Interestingly despite the recent rally in technology and internet stocks, Trade Me has been left behind. It’s a rarity in this current market – a growing company in an attractive sector with plenty of free cash flow trading in line with its historical averages. It’s worth considering that REA, Domain and Seek all trade over 30 times earnings. 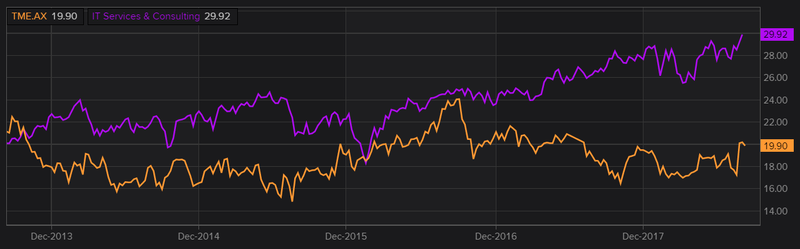 Source: Thomson Reuters There is a lot of exuberance in the market at present with stocks most notably in the Technology sector trading at high valuations. Elsewhere, Healthcare stocks are trading at their highest multiples since 2002 and certain other mid-caps are trading at or near record highs. The rally in these sectors, in our opinion has pushed up valuations across the board with all sectors in the ASX 200 with the exceptions of Telcos trading above their long term average. Despite this there are some pockets of value for investors willing to look. Even within the Technology space, we can find growing companies trading on reasonable multiples. We think a time is coming where valuations will matter and investors need to be positioned accordingly.
0 Comments
Your comment will be posted after it is approved.
Leave a Reply. |
Markets & CommentaryAt TAMIM we are committed to educating investors on how best to manage their retirement futures. Sign up to receive our weekly newsletter:
TAMIM Asset Management provides general information to help you understand our investment approach. Any financial information we provide is not advice, has not considered your personal circumstances and may not be suitable for you.
Archives
April 2024
Categories
All
|
 RSS Feed
TAMIM | Equities | Property | Credit
DISCLAIMER
The information provided on this website should not be considered financial or investment advice and is general information intended only for wholesale clients ( as defined in the Corporations Act). If you are not a wholesale client, you should exit the website. The content has been prepared without taking into account your personal objectives, financial situations or needs. You should seek personal financial advice before making any financial or investment decisions. Where the website refers to a particular financial product, you should obtain a copy of the relevant product services guide or offer document for wholesale investors before making any decision in relation to the product. Investment returns are not guaranteed as all investments carry some risk. The value of an investment may rise or fall with the changes in the market. Past performance is no guarantee of future performance. This statement relates to any claims made regarding past performance of any Tamim (or associated companies) products. Tamim does not guarantee the accuracy of any information in this website, including information provided by third parties. Information can change without notice and Tamim will endeavour to update this website as soon as practicable after changes. Tamim Funds Management Pty Limited and CTSP Funds Management Pty Ltd trading as Tamim Asset Management and its related entities do not accept responsibility for any inaccuracy or any actions taken in reliance upon this advice. All information provided on this website is correct at the time of writing and is subject to change due to changes in legislation. Please contact Tamim if you wish to confirm the currency of any information on the website.
magellen, kosec, clime, wilson, wam, montgomery, platinum, commsec, caledonia, pengana, tamim