
|
This week we take a dive into energy markets, in particular the likely medium to long term outlook for the sector. We have previously written on the potential dislocations both in uranium spot prices (which we wrote off last year) and the potential upward trajectory in oil prices. The former has seemingly played out (though it may still be very much in its infancy) and the second seems to be playing out in real time with Brent futures trading at US$85.45 per barrel and WTI at US$83.73 per barrel. Many would also be aware of the sheer scale of disruptions in the UK and broader shortages of LNG in the Eurozone heading into winter. Even more recently, the headlines have been taken over by blackouts in China in the face of increased demand. So, what has happened? Especially after coming off negative prices in the middle of 2020 and a seeming supply glut in oil. Context  Author: Sid Ruttala Author: Sid Ruttala For those that have watched recent price action, there has seemingly been an upward trajectory in spot prices despite bearish signals. Per the last EIA report, US crude inventories building close to 6m barrels and doing so within broader expectations of drawdowns, while gasoline and distillates drew down approximately 2m barrels. Combine this with US production bouncing back to 11m barrels and this would usually indicate rather bearish signals. However, there is a catch, the underlying data isn’t necessarily what is important, rather how the market reacts to said data. In this instance, it is a clear indication that the market is seeing something that we may be missing. Before we go further, understand that shorter term spikes may be due to certain intricacies and quirks of the calendar. For example, the price action and moves earlier this month (on 11 September) may have been due to Columbus Day. The nature of the futures market is such that traders have to consistently roll contracts in order to maintain positions. Days like that, when the futures market remains open whilst the banks close, will inevitably mean a little manipulation (i.e. same day settlement requirement while banks remain closed). But, taking those exceptions out of the equation, we are clearly seeing signs that we may be in for a bumpy ride. For those that have read our previous articles on this issue, our base case was that when demand does inevitably pick up post-covid we are likely to see supply bottlenecks precisely at a time when demand started to pick up. This was during the depths of covid when prices became negative and when the question became where to store the product; we saw the flip side with an increasing lack of investment in the western world (due to climate policy), high cost of production for shale in the US (which saw increased shut ins). What we were perhaps wrong on was the resurgence of US production, which beat even our most optimistic expectations. So, what has led to this situation? We are by no means climate change sceptics nor are we against renewables, the infrastructure for which still requires investment in the underlying technologies and associated capital for commercialisation and global scale. What we have found bizarre is the sheer lack of nuance and understanding of the dislocations that may take place. Take for example, the recent International Energy Agency (IEA) report whose STEPS model presents the below case:
The above seems plausible aside from some fundamental assumptions that don’t sit well with even the most basic understanding of how economies transition or political incentives operate. For one thing, it assumes that nations with net zero targets stick to their goals. After the recent blackouts in China and the long queues at petrol stations (in the UK) we don’t think the transition occurs quite so smoothly. Secondly, there is also the assumption that 45% of the energy mix in the Asia region will be accounted for by renewables, as some of these emerging markets move into middle income countries. In fact, it is assumed that energy consumption will flatline or decline in emerging markets such as India. History, however, tells us that it is simply not true, consumption increases exponentially as people and nations move into middle-income. The problem? A lot of these assumptions not only determined the policy environment but also the flow of investment and capital. Think for a moment about the yield on bonds for coal or oil producers such as Newcastle Coal (yielding 10.29%) or AGL’s inability to find requisite debt financing. Can you really blame investors? Think for a moment about a bank trying to finance said deal, requiring capex that typically has a pay off over a multi-decade period. Assuming that at some point the transition occurs and the market has dried up, what then happens to said assets? They are what is termed stranded assets. Many have commented on the ability of nations such as Saudi Arabia or Russia to increase production, especially given their low cost of production. Saudi for example has a cost base of US$2.80 per barrel. What we feel is that investors should rather use what is termed the budgetary breakeven, which is the breakeven price in order to run a balanced budget (especially in the absence of taxation) which currently stands at US$67.80 per barrel for the Kingdom. Suffice it to say, OPEC broadly has an incentive to keep supply limited in order to drive gross margins and profitability. Here is where the IEA may be onto something. It makes the conclusion that producers are incentivised, given the uncertainty around the future, to focus on existing production (as opposed to bringing on new production) in order to generate the highest possible profits. So, what does this mean? Put simply, we will see a massive disincentivisation to bring on additional production, despite demand as the world transitions over a twenty year period (the IEA’s most optimistic forecast). Given this base case and assuming current trends continue to stay at status quo, we are likely to see increased oil prices. We previously made the call that we would see this happen this year. We very much see this still in its infancy with triple digits quite possible in the near-term. What are the implications? When we talk about the price of oil, many immediately equate it to the price paid at the petrol station. Consider the broader implications of this. The chart below shows the FAO Food Price Index, a measure of the monthly change in international prices of a basket of staple food commodities, between 1990 to 2015. The highest period of per annum growth? Between 2003 to 2008. The price of oil during the same period? Went from US$20 per barrel to a peak of US$140 per barrel. 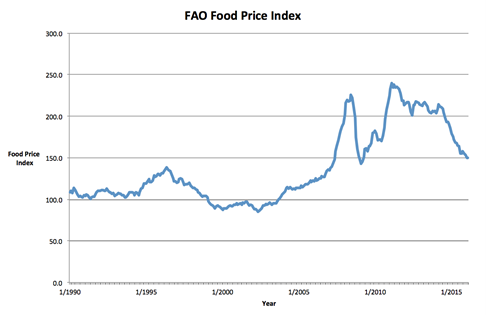 Source: FAO Consider the follow-on impact on CPI and inflation in an era where monetary policy is likely to be curtailed due to the sheer size of debt issued over the decade since the GFC. Consider also the implications for large energy importers such as India and China, who are heavily dependent on the sector and the consequent lower growth prospects in the broader global economy. How do we profit? We’ve previously written on Woodside (WPL.ASX) and continue to feel that this is a fantastic prospect. Buying larger companies (i.e. further up the maturity curve) with existing low cost production is the more reasonable way to generate returns (as opposed to smaller ones unless looking at M&A prospects). Looking globally, those looking like good buys are Exxon Mobil (XOM.NYSE), Enbridge (ENB.TSE) - pipelines - and APA Group (APA.ASX). These businesses should continue to generate massive cash flows over the next decade. Looking more broadly, as upward pressure on inflation continues despite lower real growth rates, focusing on defensive plays should be beneficial. BHP’s recent venture into potash and price action in fertilizers is rather telling. Defensive here means generating revenues that are correlated to inflation (as opposed to growth,which has consistently done well for investors in the past two decades). This morning WPL released its quarterly guidance, where the realised price stood at US$59 per barrel and sales revenue up 19% despite a slight decline in production (by 2%). This is the market’s incentive. Focus on margins through higher price realisation while at the same time flatlining or downward pressure on production. Disclaimer: WPL.ASX and XOM.NYSE are both currently held in TAMIM portfolios.
2 Comments
Jeff Jamieson
21/10/2021 07:04:27 pm
A great piece - Well done.
Desmond Smith
24/10/2021 05:06:06 pm
Excellent article Sid Your comment will be posted after it is approved.
Leave a Reply. |
Markets & CommentaryAt TAMIM we are committed to educating investors on how best to manage their retirement futures. Sign up to receive our weekly newsletter:
TAMIM Asset Management provides general information to help you understand our investment approach. Any financial information we provide is not advice, has not considered your personal circumstances and may not be suitable for you.
Archives
April 2024
Categories
All
|
 RSS Feed
TAMIM | Equities | Property | Credit
DISCLAIMER
The information provided on this website should not be considered financial or investment advice and is general information intended only for wholesale clients ( as defined in the Corporations Act). If you are not a wholesale client, you should exit the website. The content has been prepared without taking into account your personal objectives, financial situations or needs. You should seek personal financial advice before making any financial or investment decisions. Where the website refers to a particular financial product, you should obtain a copy of the relevant product services guide or offer document for wholesale investors before making any decision in relation to the product. Investment returns are not guaranteed as all investments carry some risk. The value of an investment may rise or fall with the changes in the market. Past performance is no guarantee of future performance. This statement relates to any claims made regarding past performance of any Tamim (or associated companies) products. Tamim does not guarantee the accuracy of any information in this website, including information provided by third parties. Information can change without notice and Tamim will endeavour to update this website as soon as practicable after changes. Tamim Funds Management Pty Limited and CTSP Funds Management Pty Ltd trading as Tamim Asset Management and its related entities do not accept responsibility for any inaccuracy or any actions taken in reliance upon this advice. All information provided on this website is correct at the time of writing and is subject to change due to changes in legislation. Please contact Tamim if you wish to confirm the currency of any information on the website.
magellen, kosec, clime, wilson, wam, montgomery, platinum, commsec, caledonia, pengana, tamim