
|
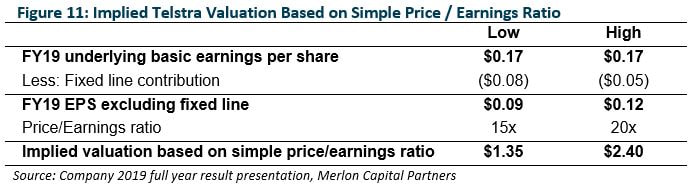
This week we present a piece by Hamish Carlisle, from Merlon Capital Partners who power the TAMIM Australian Equity Income IMA, examining the value of one of Australia's household names. Is Telstra destined for a decline? This piece was originally published on 30 September 2019. We have discussed our Telstra investment view in earlier commentary and we don’t believe much has changed in relation to our long-term expectations. However, the most recent result surprised in its complexity and is indicative of weak accounting, short termism and weak board oversight of management. Critical elements of our thesis remain: 1 - EBITDA metrics being trumpeted by management are a poor proxy for cash flow and valuations based off this metric are fundamentally flawed. Merlon’s preferred measure of intrinsic value is to compare a company’s enterprise (or unleveraged) value with its sustainable enterprise-free-cash-flow. 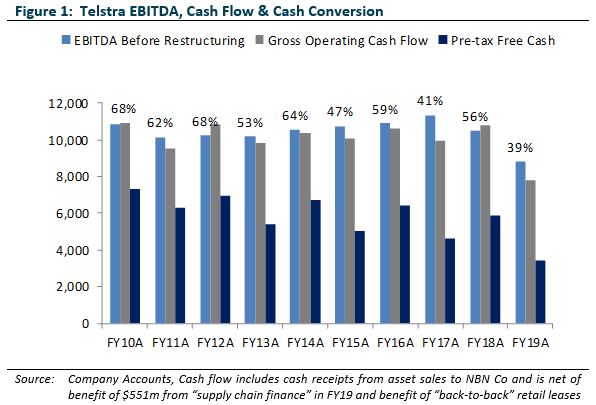 2 - Retailing NBN services will remain a loss leader for Telstra with current cost cutting initiatives destined to offset margin compression from the NBN transition rather than deliver absolute upside. 3 - Mobile margins are high relative to international peers. Weak accounting in Telstra’s most recent report add to our concerns and we see risk skewed to the lower end of our $1.80 and $4.50 valuation range. In particular we note (i) persistent references to EBITDA; (ii) unintelligible footnotes; (iii) “innovative” approaches to working capital management; and, (iv) an over-emphasis on earnings projections. Excluding unsustainable fixed line earnings Telstra’s FY19 EPS was $0.09 to $0.12 which would yield valuations of $1.35 to $2.40 if capitalised at 15 to 20x. Introduction Before calling out specifics of the most recent Telstra result, we thought it would be worthwhile highlighting a few comments made in Berkshire Hathaway’s 2002 annual report. 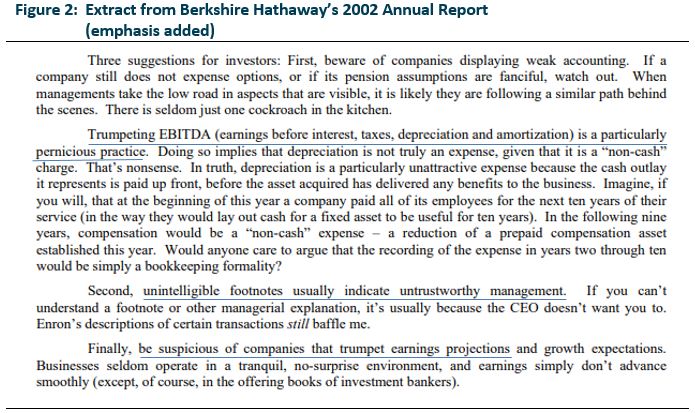 Source: Berkshire Hathaway 2002 Annual Report In particular, Buffet shares our cynicism about (i) “EBITDA” as a measure of value (we focus on free-cash-flow); (ii) complex accounts (free-cash-flow is more difficult to manipulate); and (iii) short term earnings projections (we take a long-term mid-cycle view). We examine Telstra against this backdrop. Trumpeting EBITDA is a particularly pernicious practice Buffet’s first suggestion is to beware of companies displaying weak accounting. This suggestion is an absolute foundation of the Merlon investment process that unwaveringly focuses on free-cash-flow not accounting earnings or asset values as the primary driver of valuation. The Telstra financial report for the year to June 2019 made 71 references to the acronym “EBITDA”; the notes to Telstra’s result presentation made 62 references; while the transcript from the results briefing made 49 appearances. The presentation itself made at least 35 more references to EBITDA in as many slides but these could not be counted electronically so this should be treated as a conservative estimate. If this doesn’t fit Buffet’s definition of “trumpeting EBITDA” then we’re not sure does. Telstra’s result includes (at least) 8 categories of EBITDA:
These definitions range from $7.8 billion at the low end to $9.4 billion at the high end. 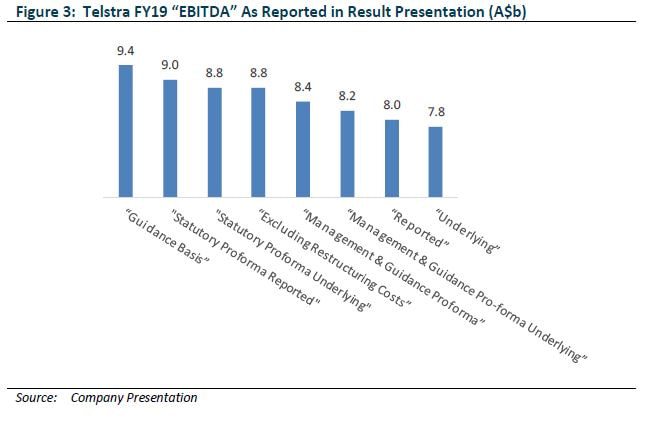 Ignore the cash flow statement at your peril It is easy to spend hours and hours trying to reconcile the various definitions of EBITDA. It is scary to contemplate the aggregate number of hours spent by security analysts working through this exercise across the investment community at large. This provides a useful distraction from actually analysing the trends in the business and the industry. At Merlon, our focus is on the cash flow statement rather than measures of “advertised” earnings. Listed companies do a good job singing the virtues of such advertised metrics often with advisers, brokers, analysts, journalists and other commentators cheering on from the sidelines. Often these advertised metrics form the basis for variable remuneration prompting management and board members to join the chorus. As we persistently highlight, management teams and boards are becoming ever increasingly creative about how they define profitability. Some of the measures highlighted above are examples of this. “Management & Guidance Pro-forma Underlying EBITDA” is yet again not a measure of profitability defined in any accounting textbook. The bottom line is that management teams can define profitability however they choose but can’t as easily hide from the realities of the cash flow statement. Every 6 months we work through the gruelling process of trying to reconcile Telstra’s various definitions of “EBITDA” to the company’s statutory cashflow statement. Eventually realities come home to roost and when this happens stocks with low earnings quality tend to underperform. Earnings are opinion; cash is fact; but not always To Telstra’s credit, the company has partially graduated from EBITDA to measures of cash flow. Having said that, nothing is simple when it comes to Telstra and the company’s definition of “free cash flow” differs from our own. Managements and boards are increasingly finding ways to distort cash flow statements. This is deeply concerning to us. An example of this is Telstra’s cash flow which may be misleading through the increased use of “reverse factoring”. Among the dozen or so highly paid sell side analysts covering the stock, it took Martin Lawrence from independent governance adviser Ownership Matters to publish research on this issue. 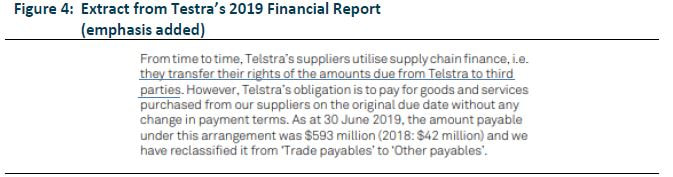 Source: Telstra 2019 Financial Report The implication of the disclosure above is that the increase in usage of “supply chain finance” boosted Telstra’s cash flow by $551 million for the year. 2019 was not the first year Telstra’s cash flow benefited from “innovative” working capital management schemes. In 2018 Telstra called out “improving working capital initiatives including Go Mobile Swap leasing.” 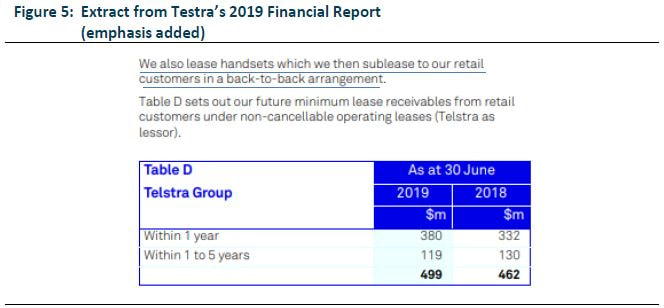 Source: Telstra 2019 Financial Report The implication of this disclosure is that this “back-to-back arrangement” boosted Telstra’s cash flow by $37 million. The real action, however, was in 2017 and 2018 where these arrangements boosted cash flow by around $500m over two years. 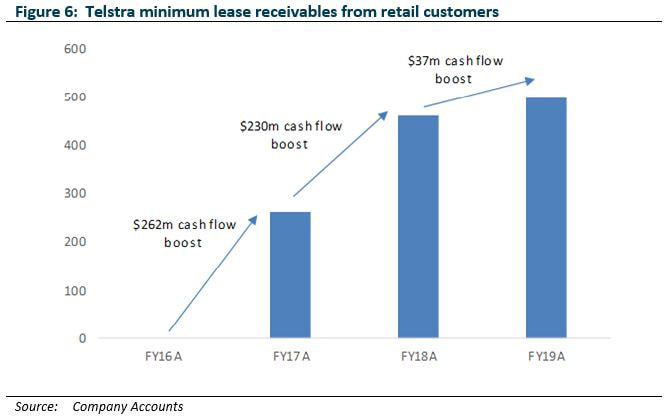 The timing of Telstra’s decision to stop selling mobile lease plans in June 2019 is curious. The decision coincides with the introduction of AASB16 which requires mobile leases be recognised as a liability on the company’s balance sheet. Telstra have stated that 2020 cash flow will be impacted by “a significant working capital increase of approximately $1 billion, driven predominantly from the exit of our mobile lease plans” It seems the new accounting standards for operating leases have thwarted the cosmetic appeal of the “back-to-back” lease arrangement and led Telstra to revert to a more conventional approach of carrying receivables on its own balance sheet. Taking these adjustments into account, Telstra’s earnings quality is poor with the company converting just 39% of its financial year 2019 “EBITDA Before Restructuring” into pre-tax cash flow. 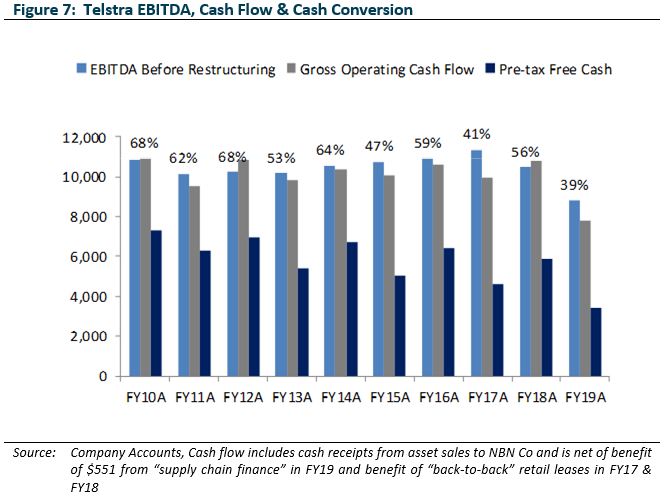 People Respond to Incentives “Most of economics can be summarized in four words: “People respond to incentives.” The rest is commentary.” ― Steven E. Landsburg, Armchair Economist: Economics And Everyday Experience The “EBITDA Before Restructuring” set by the board for the purposes of determining management remuneration was $9.2 billion. A cursory glance at the various definitions of EBITDA included in Figure 3 highlights that this target was missed by all but one of the measures disclosed in the result presentation including the measure upon which the target was supposed to be based. That said, the board took it upon itself to create a ninth definition of EBITDA “for the purpose of the EVP [Executive Variable Remuneration Plan] performance measure. This figure came in at $9.1 billion but only after adding back more restructuring than initially envisaged ($0.8 billion vs $0.6 billion) and more software write-downs than initially envisaged ($0.5 billion vs nil). The inclusion of “Free Cash Flow” in as an EVP performance measure may also explain the company’s “innovative” approaches to working capital discussed earlier. Unintelligible footnotes indicate untrustworthy management Buffet’s second suggestion is that if you can’t understand a footnote its usually because the CEO doesn’t want you to. On that front, Telstra’s result presentation is littered with footnotes. Remember that the presentation is meant to summarise the company’s results. Overleaf are some of the footnotes from Telstra’s result presentation. Even something as seemingly simple as explaining how Telstra arrived at its 16 cent per share dividend appears wrought with complexity. This is a big issue for a company with such a large retail shareholder base who rely on dividend yield as a key measure of valuation. 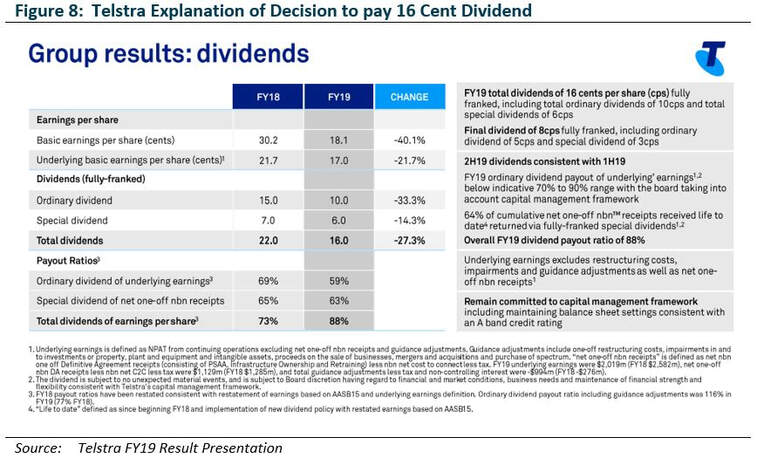 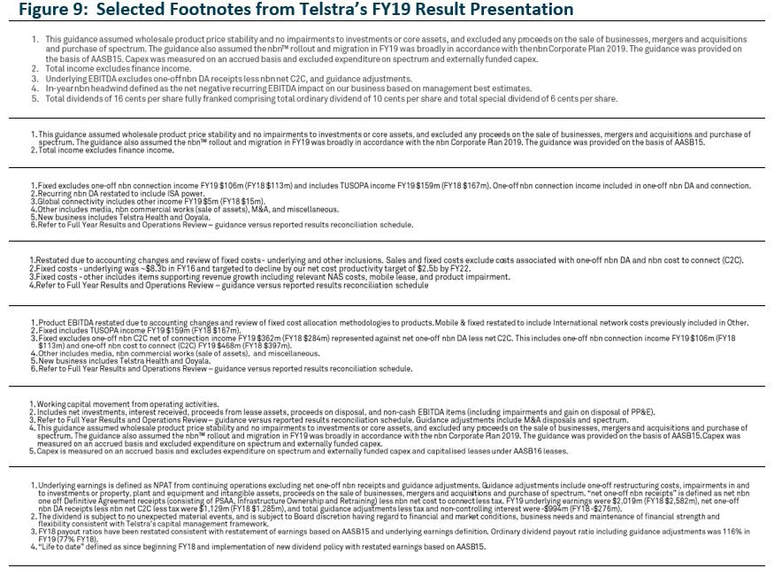 Be Suspicious of Earnings Projections Despite Buffet’s suspicions about earnings projections, no Telstra result presentation would be complete without guidance. And no Telstra guidance would be complete without an updated definition of “Underlying EBITDA” (“includes amortisation of mobile leasing costs”) and without six accompanying footnotes. Whether these footnotes meet Buffet’s criteria of “unintelligible” we will leave to our readers’ discretion. 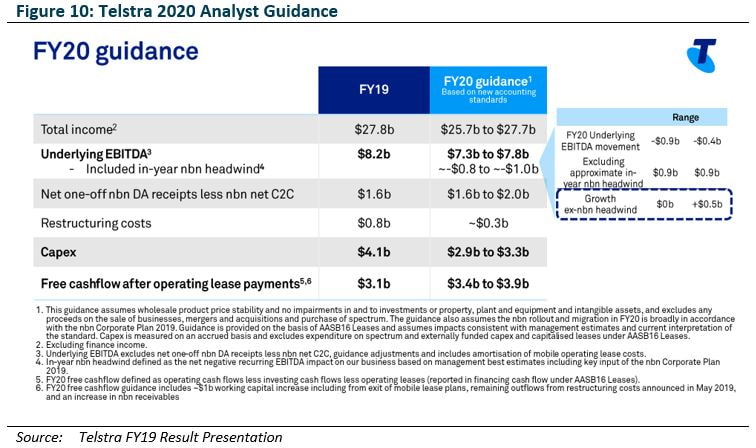 While the presence of such “Guidance” is hardly surprising, it is remarkable the extent to which the market relies upon it in forming expectations. One analyst report commented that “Overall, Telstra tends to be conservative in setting guidance” notwithstanding the fact that the company missed its 2019 EBITDA guidance on all but one the eight categories reported and missed its 2019 free cash flow guidance notwithstanding “innovative” working capital management initiatives. Is Telstra a Good Investment? We have discussed our investment view in earlier commentary and we don’t believe much has changed in relation to our long-term expectations. Critical elements of our thesis remain:
How to Value Telstra? Merlon’s preferred measure of intrinsic value is to compare a company’s enterprise (or unleveraged) value with its sustainable enterprise-free-cash-flow. In the case of Telstra this approach gives rise to a valuation range of between $1.80 and $4.50. Our view is that risks are skewed towards the lower end of this range. Taking a more simplistic approach to valuation yields the same conclusion. In particular we note that:
 We do not hold Telstra shares in our portfolios.
0 Comments
Your comment will be posted after it is approved.
Leave a Reply. |
Stock CommentaryAt TAMIM we are committed to educating investors on how best to manage their retirement futures. Sign up to receive our weekly newsletter:
TAMIM Asset Management provides general information to help you understand our investment approach. Any financial information we provide is not advice, has not considered your personal circumstances and may not be suitable for you.
Archives
April 2024
Categories
All
|
 RSS Feed
TAMIM | Equities | Property | Credit
DISCLAIMER
The information provided on this website should not be considered financial or investment advice and is general information intended only for wholesale clients ( as defined in the Corporations Act). If you are not a wholesale client, you should exit the website. The content has been prepared without taking into account your personal objectives, financial situations or needs. You should seek personal financial advice before making any financial or investment decisions. Where the website refers to a particular financial product, you should obtain a copy of the relevant product services guide or offer document for wholesale investors before making any decision in relation to the product. Investment returns are not guaranteed as all investments carry some risk. The value of an investment may rise or fall with the changes in the market. Past performance is no guarantee of future performance. This statement relates to any claims made regarding past performance of any Tamim (or associated companies) products. Tamim does not guarantee the accuracy of any information in this website, including information provided by third parties. Information can change without notice and Tamim will endeavour to update this website as soon as practicable after changes. Tamim Funds Management Pty Limited and CTSP Funds Management Pty Ltd trading as Tamim Asset Management and its related entities do not accept responsibility for any inaccuracy or any actions taken in reliance upon this advice. All information provided on this website is correct at the time of writing and is subject to change due to changes in legislation. Please contact Tamim if you wish to confirm the currency of any information on the website.
magellen, kosec, clime, wilson, wam, montgomery, platinum, commsec, caledonia, pengana, tamim