
|
This week the TAMIM Small Cap team take a look under the bonnet of their portfolio and take a look at its breakdown. They examine debt profile, industry exposure, company life cycle and cash weightings. Summary:The 82% out-performance, by the portfolio behind the TAMIM Small Cap IMA, of the All Ords after fees since launch 2 years & 7 months ago has been achieved by investing in high quality, growing smaller companies trading at a significant discount to fair value. In the interests of lifting the hood on the engine for the benefit of investors, we have taken the opportunity to compile an analysis of the portfolio’s risk profile by looking at the portfolio’s composition based upon stage in the business cycle, debt profile, portfolio cash levels and industry exposures. We believe the results emphatically show the underlying fund’s performance has been achieved with a relatively low risk profile, and the fund remains well positioned looking forward for the same reasons. THE SMALLER COMPANIES UNIVERSE IN THE SOBERING LIGHT OF DAYFirstly, it is worth highlighting the key characteristics of the companies within the TAMIM Small Cap IMA’s investable universe of micro/small cap companies listed on the ASX: 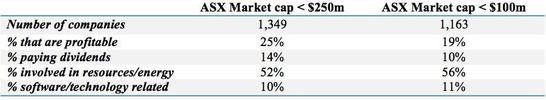 Source: ASX These numbers may be sobering for some: a massive 81% of ASX-listed micro caps (market cap below $100m) are currently loss-making and 90% don’t pay a dividend. The smaller companies’ universe is clearly dominated by unprofitable, non-dividend paying companies with a strong weighting towards the resource and technology companies, which we consider to be at the higher end of the risk spectrum. The challenge for us is to find, research and ultimately invest in the relatively small number of small and micro-cap stocks which have lower risk profiles. In our opinion, companies which are profitable, with good visibility around future earnings growth, and which also have strong balance sheets, offer a significant opportunity for long term out-performance, particularly when you invest whilst broader market awareness of these businesses is low or non-existent. As a result, despite the fact that the ASX small and micro-cap universe is dominated by high risk, unprofitable companies, the TAMIM Small Cap portfolio has been constructed such that these risks have been substantially mitigated. Given this backdrop, the following 4 perspectives of portfolio risk should provide valuable insight into the TAMIM Small Cap portfolio… 1. CASH WEIGHTING:Why? A portfolio’s cash weighting is a risk input worth understanding – a higher cash weighting indicates lower risk and vice versa. Observations: The Small Cap Portfolio will generally carry a higher cash weighting than most portfolios reflecting our deep-held belief that our clients will benefit if we are positioned to take advantage of future periods of stock price volatility. There will be periods when the market becomes overly emotional and will offer our high conviction holdings at significant discounts to our opinion of fair value. We want to be ready for this periods of volatility ahead of time. As a result, the portfolio currently has a cash weighting of 22%. In terms of assessing the portfolio’s risk, this relatively large cash weighting provides a risk buffer but we would argue this high cash weighting is more important to generate performance upside than as a risk control. Selecting the right stocks is a far more efficient risk control in our experience. Comparison versus 1 year ago: No change – it is our intention to maintain a high cash weighting to take advantage of opportunities as they emerge. 2. PORTFOLIO CATEGORISED BY COMPANY LIFE CYCLEWhy? We have divided the portfolio into a number of categories to reflect where each business is in the company life cycle, which in turn gives a guide regarding the portfolio's risk profile at a stock level. The life cycle categories we have used are: i) fund cash, ii) dividend paying, growing profits, iii) asset play, iv) profitable, not dividend paying, v) loss-making, emerging, fully funded, and vi) loss-making, emerging, not fully funded. The risk profile of these different types of investments starts at very low (fund cash) and incrementally increases to very high (loss-making, emerging, not fully funded). While simplistic, we believe a company that has committed to paying dividends, and which has high visibility around future earnings, can be classified as the most mature on the company life cycle scale, and among the lowest risk of listed equity investments. Conversely, a loss making, early stage business without sufficient funds to execute on its strategic initiatives is among the highest risk of listed equity investments. TAMIM Small Cap portfolio - By stage in the business cycle: 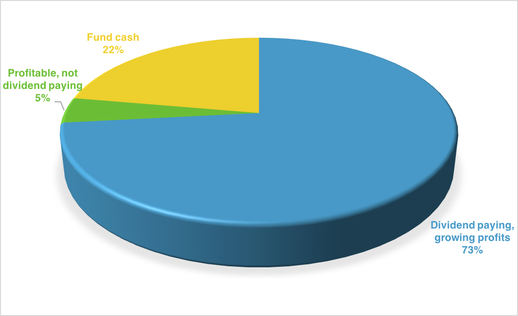 Observations: With 73% of the portfolio invested in dividend paying companies which are growing their earnings and 22% of the portfolio in cash, 95% of the portfolio can be categorised as low risk in our opinion. Given our strategy is to invest in high quality businesses which are under-valued, it is pleasing to see that the data confirms we are doing what we say we are doing. The 73% exposure to companies which are paying dividends on the back of a growing earnings base, and which have been purchased at low earnings multiples, is the portfolio's core engine. These are the types of businesses we aim to get to know better than the market, and this in depth stock knowledge is core to our risk control. We are always questioning our assumptions and understanding of these businesses to ensure our conviction levels are warranted. The portfolio also has 5% invested in companies that are profitable but are not yet paying dividends. We expect this 5% of the portfolio to migrate across to become dividend paying in the coming year or so, furthering decreasing the portfolio’s risk profile. The portfolio has no exposure to loss-making companies whether they be funded or unfunded. This implies the portfolio is actively avoiding the 81% of the sub $100m market cap universe which is currently loss-making and thus arguably higher risk. We believe this shows the portfolio remains conservatively positioned in companies at the low risk end of the spectrum and will remain so looking forward. Comparison versus 1 year ago: As we would have hoped (and wrote in the first version of this report one year ago), there has been an increase in the portion of dividend paying with growing profits businesses in the portfolio – these have increased from 62% to 73% of the portfolio in the past year. We believe the portfolio’s risk profile has decreased as a result. 3. PORTFOLIO CATEGORISED BY DEBT PROFILEWhy? In our opinion a company’s balance sheet is a key input when assessing risk. Companies with strong balance sheets carry far lower financial risk profiles than companies with weak balance sheets. The reason is clear: debt-holders rank ahead of equity holders in the event of financial distress; so the larger the queue of debt-holders, the less likely equity holders will receive their funds in a worst case scenario. In addition, less debt means greater financial flexibility and less exposure to interest rate cycles. TAMIM Small Cap portfolio - By debt profile: 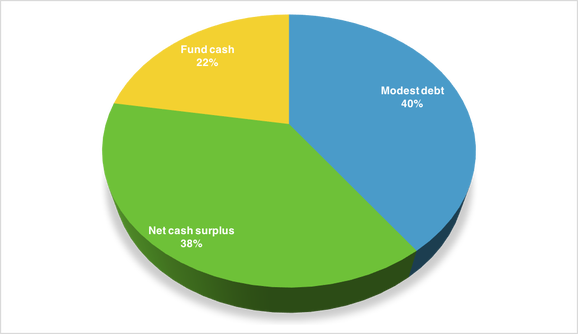 Observations: 38% of the portfolio is invested in stocks with net cash surpluses which is consistent with our objective of investing in high quality companies with strong balance sheets. These companies carry far lower financial risk than highly geared companies. 40% of the portfolio is invested in stocks with modest gearing levels (under 50% net debt/equity ratio). And 22% of the portfolio is in cash as mentioned above. The portfolio has no positions in highly leveraged businesses. We view the portfolio’s overall financial risk as low, and far lower than the broader smaller companies’ universe which is heavily weighted to highly leveraged businesses. Comparison versus 1 year ago: No change – the portfolio remains exposed to businesses with relatively low financial risks. 4. PORTFOLIO EXPOSURE BY INDUSTRY EXPOSUREWhy? We believe looking at a portfolio's sector weightings is another worthwhile way to make sense of any industry related risks which may only become clear from a top-down perspective. TAMIM Small Cap portfolio - By industry: 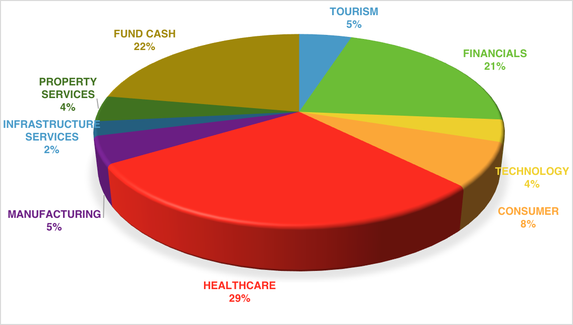 Observations: The portfolio's sector exposures are: Healthcare 29%, Cash 22%, Financials 21%, Consumer 8%, Manufacturing 5%, Property Services 4%, Technology 4%, Tourism 5% and Infrastructure Services 2%. We view this as a well-diversified portfolio with a tilt towards defensive businesses. Comparison versus 1 year ago: The main change has been an increase in the Healthcare sector weighting from 24% to the current 29%, an increase in the Tourism weighting from 0% to 5%, and a decrease in the Property Services weighting from 8% to 4%. These changes have been driven purely by our bottom up stock selection process, but it is fair to say from a top-down perspective that these changes arguably entail a move to a more defensive, lower risk portfolio position with supportive industry tailwinds. Conclusion:The TAMIM Small Cap portfolio’s risk profile is arguably lower than many may assume given its micro and small cap focus. This reflects a focus upon investing in high quality businesses with strong balance sheets, as well as our disciplined value investing approach. The portfolio remains very heavily weighted to high quality businesses which are growing their earnings and paying dividends, and yet are trading on low multiples and often with net cash surpluses and excellent management. We believe these conservative investment foundations put the portfolio in good stead to continue its track record looking forward.
0 Comments
Your comment will be posted after it is approved.
Leave a Reply. |
Markets & CommentaryAt TAMIM we are committed to educating investors on how best to manage their retirement futures. Sign up to receive our weekly newsletter:
TAMIM Asset Management provides general information to help you understand our investment approach. Any financial information we provide is not advice, has not considered your personal circumstances and may not be suitable for you.
Archives
April 2024
Categories
All
|
 RSS Feed
TAMIM | Equities | Property | Credit
DISCLAIMER
The information provided on this website should not be considered financial or investment advice and is general information intended only for wholesale clients ( as defined in the Corporations Act). If you are not a wholesale client, you should exit the website. The content has been prepared without taking into account your personal objectives, financial situations or needs. You should seek personal financial advice before making any financial or investment decisions. Where the website refers to a particular financial product, you should obtain a copy of the relevant product services guide or offer document for wholesale investors before making any decision in relation to the product. Investment returns are not guaranteed as all investments carry some risk. The value of an investment may rise or fall with the changes in the market. Past performance is no guarantee of future performance. This statement relates to any claims made regarding past performance of any Tamim (or associated companies) products. Tamim does not guarantee the accuracy of any information in this website, including information provided by third parties. Information can change without notice and Tamim will endeavour to update this website as soon as practicable after changes. Tamim Funds Management Pty Limited and CTSP Funds Management Pty Ltd trading as Tamim Asset Management and its related entities do not accept responsibility for any inaccuracy or any actions taken in reliance upon this advice. All information provided on this website is correct at the time of writing and is subject to change due to changes in legislation. Please contact Tamim if you wish to confirm the currency of any information on the website.
magellen, kosec, clime, wilson, wam, montgomery, platinum, commsec, caledonia, pengana, tamim