
|
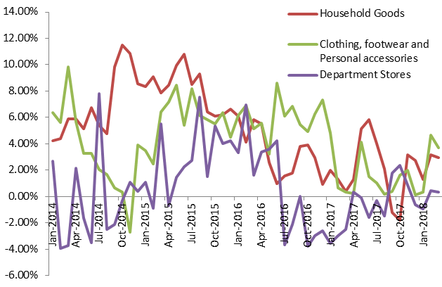
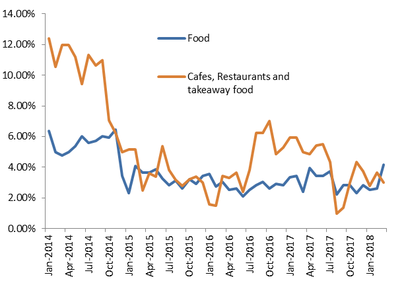
This week Guy Carson takes an in depth look at the retail sector, the impact of online retail and a stock that he owns to gain exposure to the sector. The ‘Retail Apocalypse’ is a term that has been used in recent years to describe the fate of traditional “Bricks and Mortar” retailers in the United States. A shift to online sales as well as a soft consumer recovery has seen over 12,000 physical retail stores close over the course of this decade. As can be seen below the number of bankruptcies has also risen with Toys R Us dominating recent headlines. 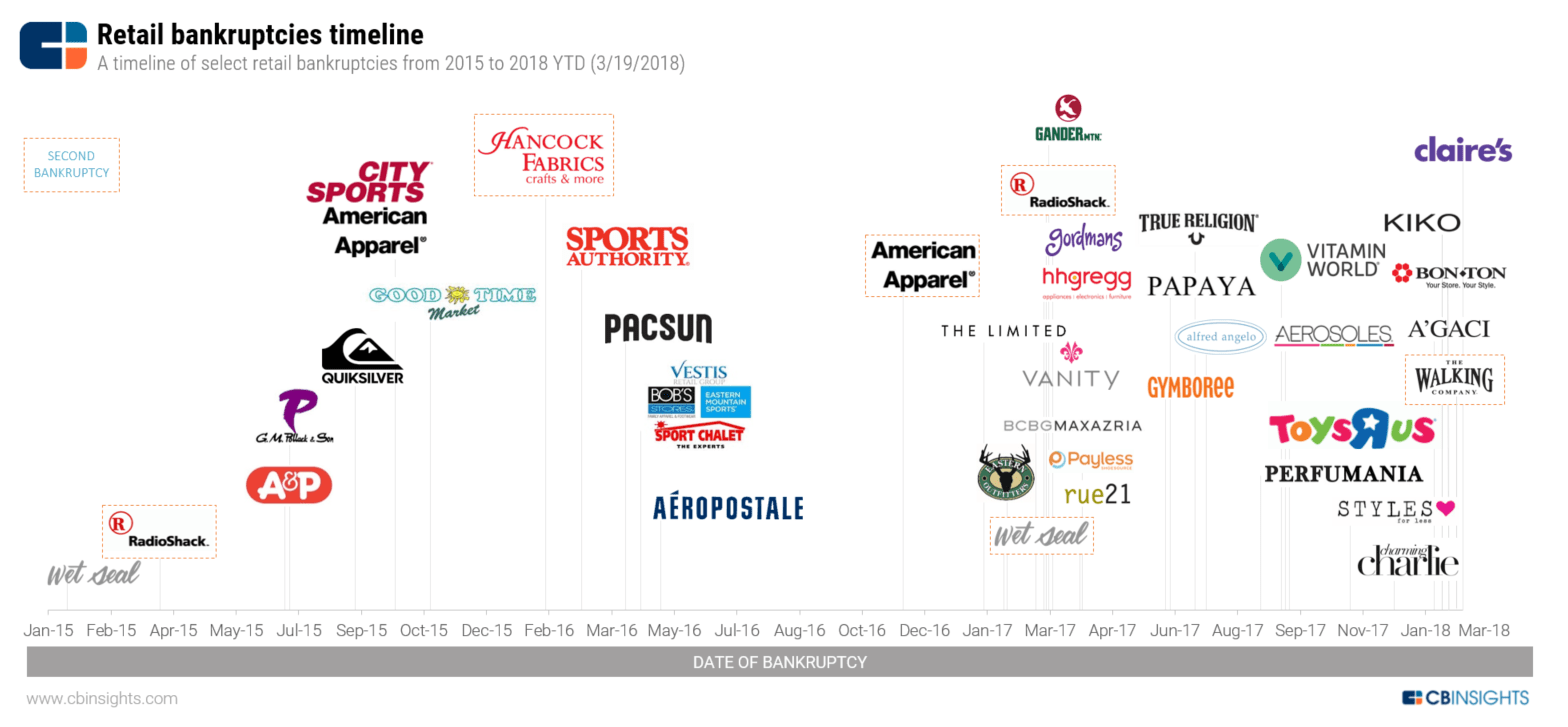 Source: CB Insights In Australia, we had Amazon launch last year the general feeling however was one of disappointment. In a rush to launch, the product list offered was far from complete. Over time the product list will grow and will have a greater on impact existing retailers. It is worth pointing out that Amazon is not the only online player, just the largest, and others are already having an impact on the traditional retail players. In our opinion, the rise of online retail is only part of the story in Australia. Since 2013, overall retail sales growth has been slowing. 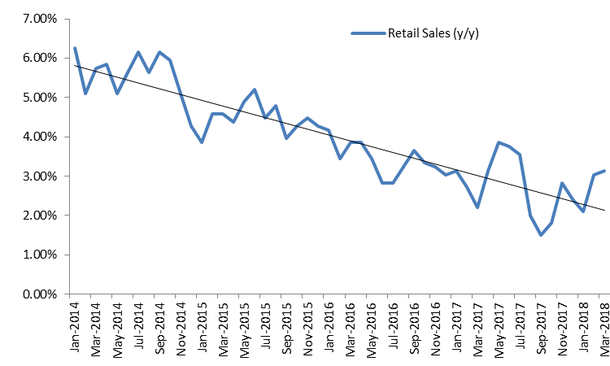 Source: ABS The weakness has been broad based across all categories. A bounce in cafes, restaurants and takeaway food in 2016 was offset by a fall in department stores. In fact, over recent times the department stores are the ones that have suffered the most with sales growth largely in negative territory.
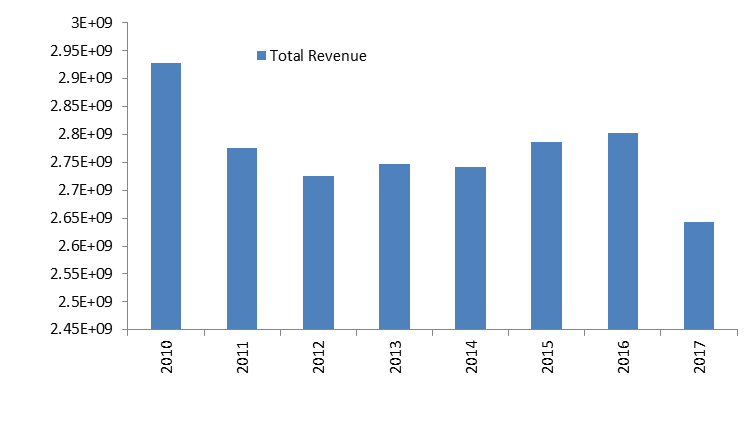
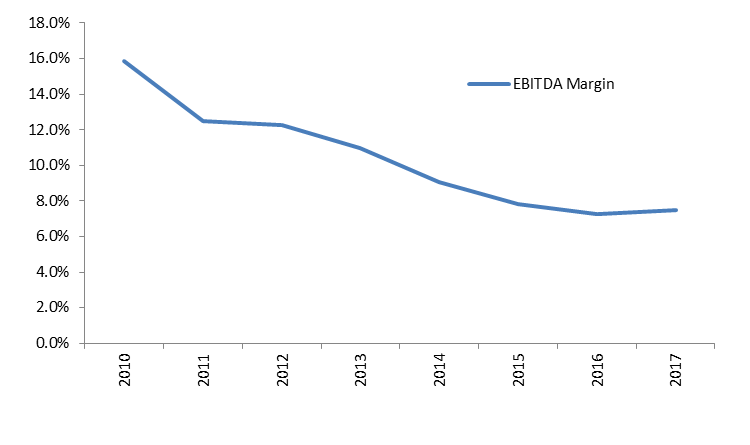
Source: ABS Stalling retail sales are a function of a household sector under pressure. Household balance sheets are stretched with Household Debt to GDP the second highest in the world behind just Switzerland. 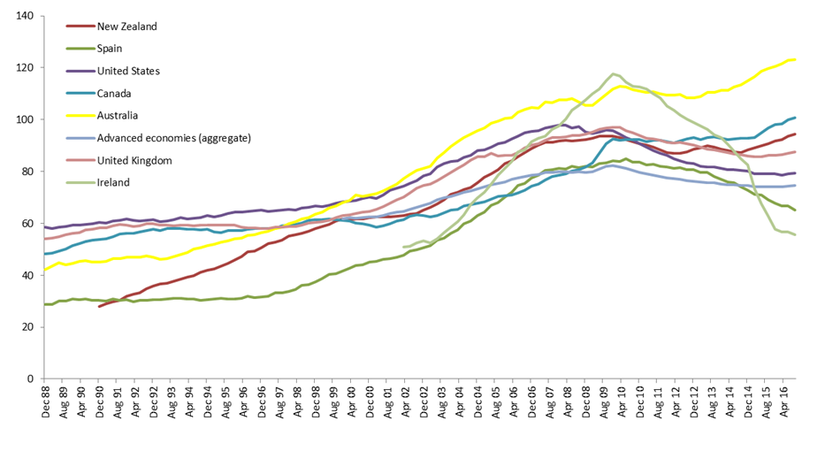 Source: Bank of International Settlements Whilst debt has risen, wage growth has stagnated in recent years and, despite the RBA and Treasury projections, there are few signs of a recovery in the near future. 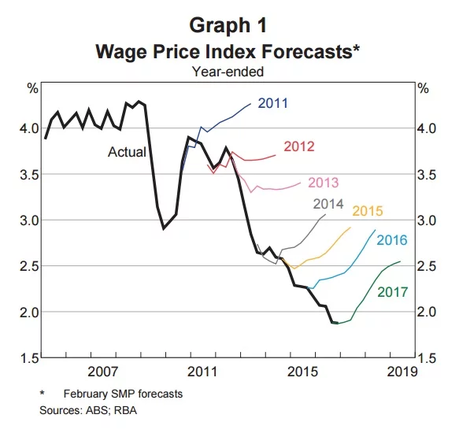 Households have a stretched balance sheet and an Income statement showing no growth, retail sales have suffered as a result. The corporate pain at this stage has been focused mainly in the department stores and the clothing and personal apparel space. We have seen Oroton enter administration and several offshore entrants face a similar fate. While the major department stores have yet to face that scenario there are significant signs of stress. Myer is essentially the poster child for struggling Australian retailers with their shares having fallen from an Initial Public Offering (IPO) price of $4.10 to around 40 cents today. The woes at Myer are easy to see. Revenue has fallen consistently since its IPO back in 2010 and margins have been destroyed by the rise of online competition, falling from the low teens to below 8%.
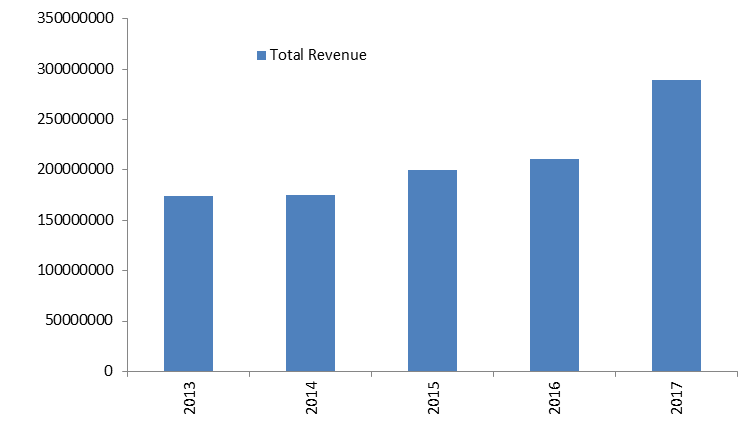
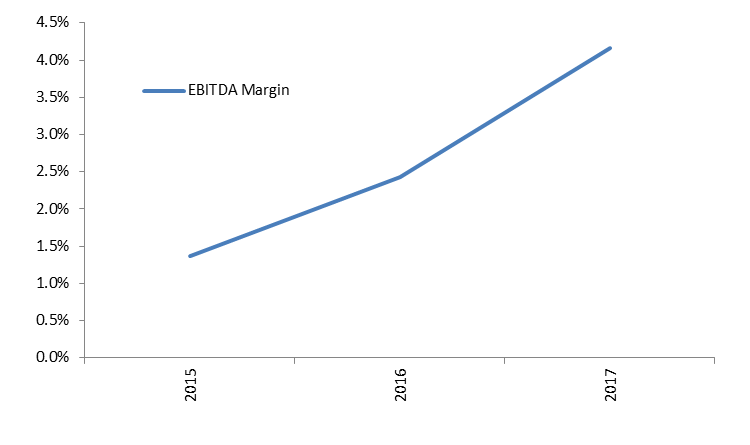
Source: Company Filings, Thomson Reuters Falling revenue and falling margins are a toxic combination and have led to significant falls in profit and cashflow. 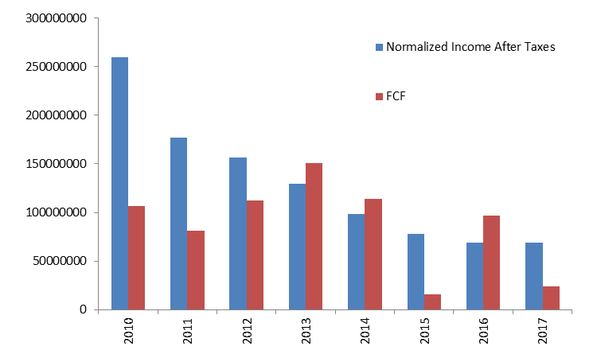 Source: Company Filings, Thomson Reuters Whilst the company currently has little debt, it does have around $2.7bn of leases that it can’t back out of. One avenue that the company has is Voluntary Administration in order to restructure these debt obligations; until that happens we find it hard to value the company as a going concern. Myer is not alone in their pain. South African based company Woolworths Holdings Limited has recently written the value of their stake in David Jones down by $712.5m. This is approximately a third of the total price they paid to acquire it back in 2014. As mentioned above, the reason these companies have suffered so much is two-fold. Firstly, the weak consumer environment above has had an impact and, secondly, online players have entered and provided a low cost alternative. Jeff Bezos famously said “Your margin is my opportunity” and most online retailers have followed this philosophy. The old margins of Myer and David Jones above 10% were unsustainable and the new competitors had a significant advantage in that they don’t have to pay rent for stores or sales staff. The result has been significant price deflation in consumer goods. One of the recent online disrupters in the Australian market has been Kogan. Kogan was founded in 2006 and listed on the ASX in 2016. In recent years the company has gone from strength to strength. Revenue has risen from approximately $200m in 2015 to almost $290m last year. Margins have risen as the company has achieved a greater scale but at 4.2% remain well below those of Myer. The combination of rising sales and higher margins has seen their first half profit this year grow 118.9% to $8.8m.
Source: Company Filings, Thomson Reuters Clearly Kogan has done a great job in disrupting the retail space in Australia. The problem is that in order to own the shares you have to pay up. Due to the success of the company, the shares now trade at a significant premium to other retail plays listed on the Australian market. This premium is justified given the growth Kogan is likely to experience, however, it remains too rich for us (we will cover this further shortly). The below table looks at valuations across the space and is a useful starting point for determining whether there are value opportunities. There are three categories we have split out – “Bricks and Mortar”, Online and Food Franchises. 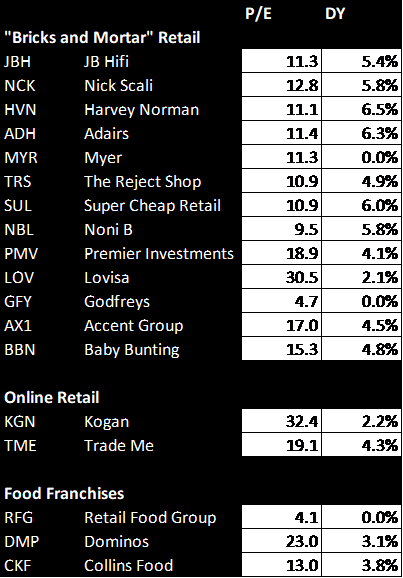 Source: Thomson Reuters, consensus estimates Bricks and Mortar The “Bricks and Mortar” space is interesting. With concern around future growth, the sector is largely trading on around 10-12x next year’s earnings. For comparison purposes, this is very similar to the current multiple that the banks, another low growth sector, trade on. A number of the companies in the sector have had significant challenges in recent years, most notably Myer and Godfreys. Whilst Godfreys has recently received a takeover offer from its founder, it would have taken a very well timed (and brave) purchase to take advantage of this. Further consolidation has occurred in the space with Noni B purchasing a majority of Specialty Fashion Group’s brands. In recent years, some of the better performers in this space share a common theme. Australia has in recent times experienced its largest ever residential building boom and, with the significant increase in new dwellings, this brought a significant increase in the demand for home furnishings. Harvey Norman, JB Hifi (through The Good Guys), Nick Scali and Adairs are all exposed to this thematic. In 2011 the RBA was staring at the end of the mining boom. In response, they started to cut interest rates and have gone from 4.75% to 1.50%. In 2012 the first positive signs started to come through, residential construction activity in Australia turned upwards. The primary focus of the boom was east coast apartments (although Western Australia did see an improvement as well). 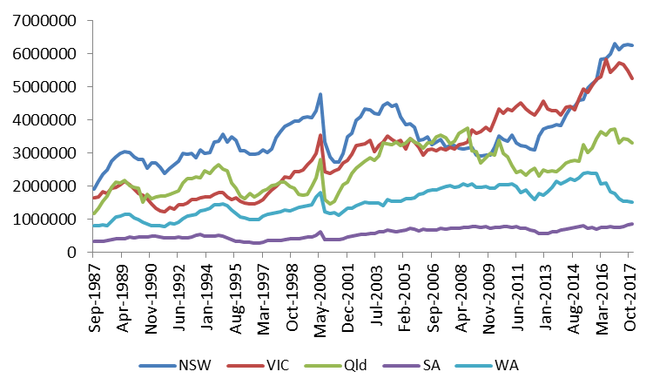 Source: ABS The problem is this boom now appears over. Residential construction activity on a national basis has detracted from GDP growth for three consecutive quarters. Activity is falling in all states apart from New South Wales as can be seen by the chart below which looks at units under construction across the different states.  Source: CoreLogic When we look through the companies above, we find all of them have the same significant improvement in profit and profitability since the building boom began in 2012. The charts below look at profit and cash flow for Harvey Norman (left) and Nick Scali (right). In 2013, both companies entered a period of growth after a period of stagnation. 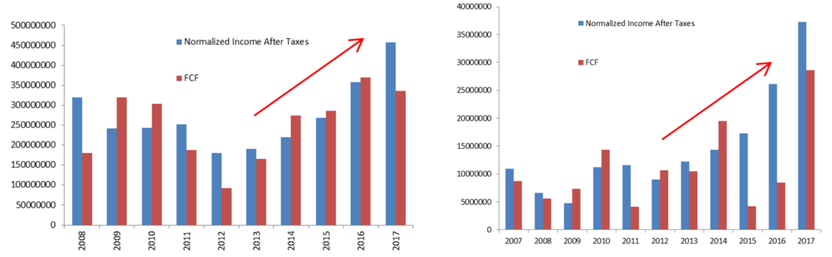 Source: Company Filings, Thomson Reuters Sales have risen over this period and margins have followed suit. This has been a tremendous operating period for these companies (charts below again show Harvey Norman on the left and Nick Scali on the right). It is not just these discretionary retailers that have seen a boost, other retailers such as Bunnings (owned by Wesfarmers) and Reece show similar characteristics with profit growth starting in 2012 after a period of stagnation. 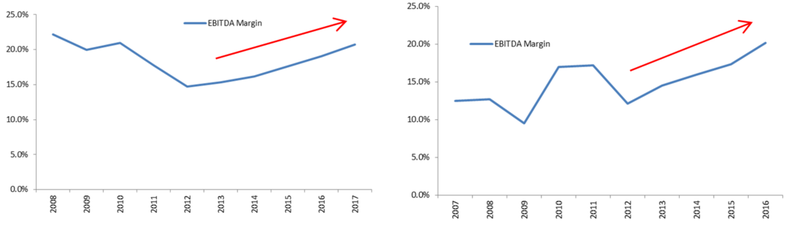 Source: Company Filings, Thomson Reuters A lot of investors are currently pointing to these businesses as quality investments and tend to forget their cyclical nature. With the building cycle starting to turn we expect some shocks over the next 12-18 months. Historically speaking, big booms are typically followed by matching busts. Food Franchises The share prices for the food franchises have come under significant pressure over the last few years. Domino’s is no longer regarded as a Tech stock and has derated significantly whilst the solvency of Retail Food Group is seriously in question. Retail Food Group shares have fallen from a high of $8 back in 2015 to around 80 cents today. The company has seen significant negative press due to unprofitable franchisees. The company has been forced to recognise this pain in its most recent accounts, recording a 31.8% drop in underlying profit and recognising an impairment of $138m. It also plans to shut down between 160 and 200 stores by the end of FY19. With net debt rising to over $250m, the company appears to well and truly in the hands of its bankers. 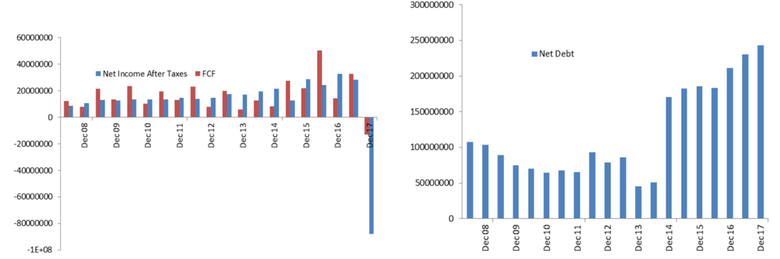 Source: Company Filings, Thomson Reuters Domino’s has also seen its price slide from a ridiculous $80.69 to the low $40 range. Despite this fall the company still trades on a significant premium to other players. Whilst its track record is very strong, increased competition for takeaway food from the likes of Uber Eats, Deliveroo and Menulog could have a significant impact. Through our investigations into Domino’s, we discover that a franchisee can earn around $70k per annum if they work full time in their own franchise store. This suggests to us that margins are paper thin and that more choices for consumers will put pressure on franchise profitability. Ultimately given the rise of technology in food ordering, we expect increased competition will continue to cause problems for the food franchise businesses. Online Businesses It will probably come as no surprise that an online exposure would be our preferred exposure in the consumer space. Online sales continue to grow and hurt traditional business models. “Brick and Mortar” retail players are forced into having an online presence but have still had to maintain a store presence and hence have a higher cost base. As can be seen in the table above, Trade Me and Kogan are the main online players in Australia. As previously discussed, Kogan’s growth has been superb in recent times. Sales have grown consistently since listing. 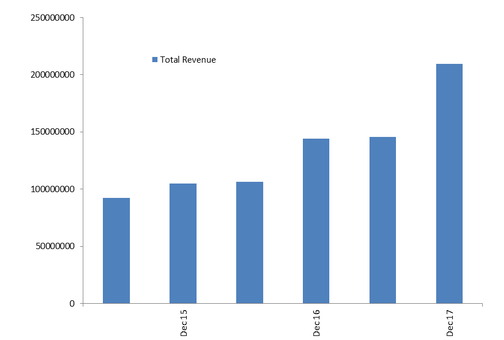 Source: Company Filings, Thomson Reuters The market is factoring significant growth going forward with a multiple of over 30x next year’s earnings. Consensus estimates have these earnings growing at around 60% in FY19 and by around 30% in FY20. Any slight miss to these growth rates could lead to a significant sell off. There are some challenges coming for Kogan. After a disappointing launch, Amazon is set to ramp up competition. Recently they have announced a fulfillment centre would be operational in the second half of 2018 in Moorebank, bringing greater access to the Sydney market. In addition, whilst Kogan has been successful in offering services such as Mobile, it isn’t their core focus. Changes in the industry can have an impact and with TPG Telecom set to offer very low cost mobile packages, we can see Kogan’s growth stalling in that area. This brings us to Trade Me, which trades on a significantly lower multiple than Kogan. The lower multiple is justified due to lower earnings per share growth. In fact the growth within Trade Me’s consumer division (Marketplace) has been virtually zero in recent years. The company has expanded significantly though with Marketplace now contributing 29% of the company’s revenue. Classifieds across Property, Jobs and Motors are now the dominant component of the business. 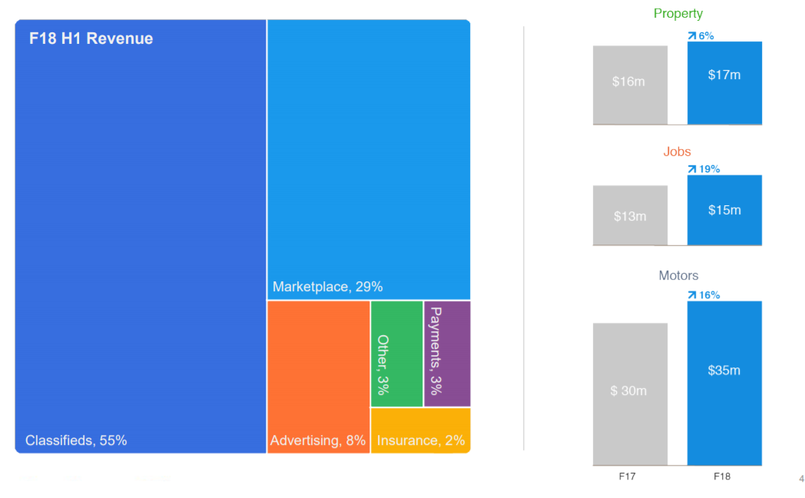 Source: Company filings As a result of the classifieds being the dominant part of the business, it is more appropriate to compare the company to the other listed classified businesses in Australia. 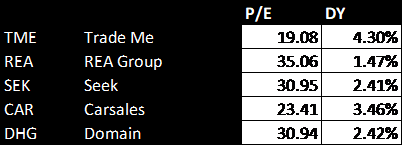 Source: Thomson Reuters, consensus estimates As you can see, Trade Me does trade at a significant discount to the other players in the classified space. Again, this is largely due to lower Earnings per Share growth. However, Trade Me has two key advantages over the other players. Firstly, it is a diversified business whilst the other operators are largely one product companies. This means it isn’t overly sensitive to one component of the business. Secondly, the expectations built into the other share prices are significantly higher than the expectations in Trade Me. We believe that the market is underestimating the growth potential in Trade Me. This is a company that has grown revenues and profit consistently since being spun out by Fairfax. 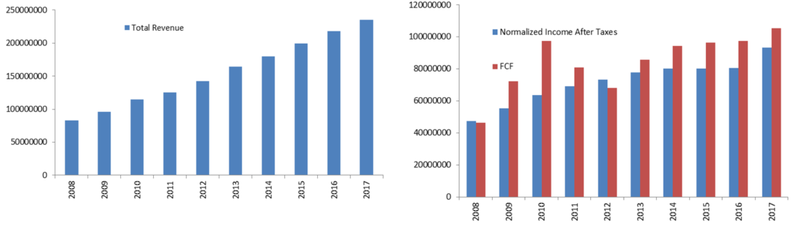 Source: Company Filings, Thomson Reuters Profit growth has lagged revenue growth as the company has invested heavily in its technology and its people. This is in order to maintain its dominant market position. Some of the offerings Trade Me has are significantly better than its competition. An example of this is the InsideView feature on its property site which allows viewers to take a virtual 3D walk through a listed property. When the company was listed it was loaded up with debt that Fairfax could not otherwise repay. That debt has come down significantly in recent periods and the company now is at a point where it may consider capital management initiatives. 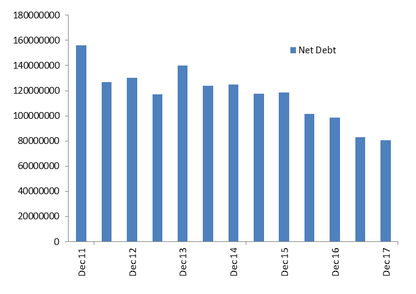 Source: Company Filings, Thomson Reuters Overall, while we do like Trade Me, we don’t expect it to shoot the lights out. What we do expect is a consistent dividend yield, single digit earnings per share growth and the potential of capital management upside. On the other side, Trade Me appears to have significantly less downside than many its peers due to a reasonable valuation and lower expectations. Conclusions
With the current state of the Australian consumer, we remain very cautious on traditional retailers. Those that have performed well in recent years tend to have significant exposure to a residential construction cycle that is past its peak. If residential construction continues to fall, earnings will likely fall and share prices will follow. The only place we expect sustainable through the cycle growth is in the online sector but, within the space, expectations are high. We are cautious on the valuations of most these companies but do believe that investors are underappreciating the growth in Trade Me. In addition, the downside within Trade Me is significantly less than other players. As a result we see it as a solid low beta consumer play within our portfolio.
0 Comments
Your comment will be posted after it is approved.
Leave a Reply. |
Markets & CommentaryAt TAMIM we are committed to educating investors on how best to manage their retirement futures. Sign up to receive our weekly newsletter:
TAMIM Asset Management provides general information to help you understand our investment approach. Any financial information we provide is not advice, has not considered your personal circumstances and may not be suitable for you.
Archives
April 2024
Categories
All
|
 RSS Feed
TAMIM | Equities | Property | Credit
DISCLAIMER
The information provided on this website should not be considered financial or investment advice and is general information intended only for wholesale clients ( as defined in the Corporations Act). If you are not a wholesale client, you should exit the website. The content has been prepared without taking into account your personal objectives, financial situations or needs. You should seek personal financial advice before making any financial or investment decisions. Where the website refers to a particular financial product, you should obtain a copy of the relevant product services guide or offer document for wholesale investors before making any decision in relation to the product. Investment returns are not guaranteed as all investments carry some risk. The value of an investment may rise or fall with the changes in the market. Past performance is no guarantee of future performance. This statement relates to any claims made regarding past performance of any Tamim (or associated companies) products. Tamim does not guarantee the accuracy of any information in this website, including information provided by third parties. Information can change without notice and Tamim will endeavour to update this website as soon as practicable after changes. Tamim Funds Management Pty Limited and CTSP Funds Management Pty Ltd trading as Tamim Asset Management and its related entities do not accept responsibility for any inaccuracy or any actions taken in reliance upon this advice. All information provided on this website is correct at the time of writing and is subject to change due to changes in legislation. Please contact Tamim if you wish to confirm the currency of any information on the website.
magellen, kosec, clime, wilson, wam, montgomery, platinum, commsec, caledonia, pengana, tamim