
|
This week we present a piece by Joey Mui, analyst with Merlon Capital Partners who power the TAMIM Australian Equity Income IMA, as they examine trends in digital and traditional media. Information current at 31 March 2018. It has been challenging few years for traditional media companies globally with share of the advertising pie increasingly allocated to digital players such as Facebook and Google. And Australia has not been immune from this trend. That said, we think there are signs that the rate of change may be slowing as advertisers become more sceptical about how digital dollars are being spent, more focused on long term brand health and more focused on data transparency. Further, both locally and globally, advertisers are experiencing deteriorating brand strength and revenues, possibly due to an over-allocation to digital relative to traditional brand marketing. 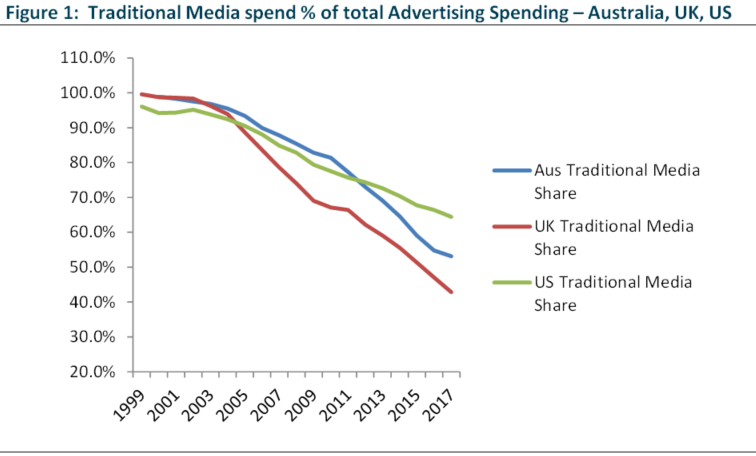 Source: Group M, Merlon Estimates Currently, spend on digital advertising represents around 47% of overall ad spending in the Australian market. This compares to digital ad spend of 57% in the UK, 36% in the United States. While it is likely that Australia’s digital share will continue to trend up over time, we do note that both Australia and the UK are higher than other comparable markets, especially the US. Australian TV Declines Over-extended When we look specifically at Television, there have been some pronounced differences in market share between these markets. Arguably some of Australia’s TV ad share decline can be attributed to impact of Netflix’s entry in 2015. Industry feedback has pointed towards overconfidence in digital marketing due to superior headline return on investment (ROI) data. Linear television has suffered disproportionately from the view that it is an expensive and “old-fashioned” medium that is inferior to the “data-rich”, short term ROI digital mediums. 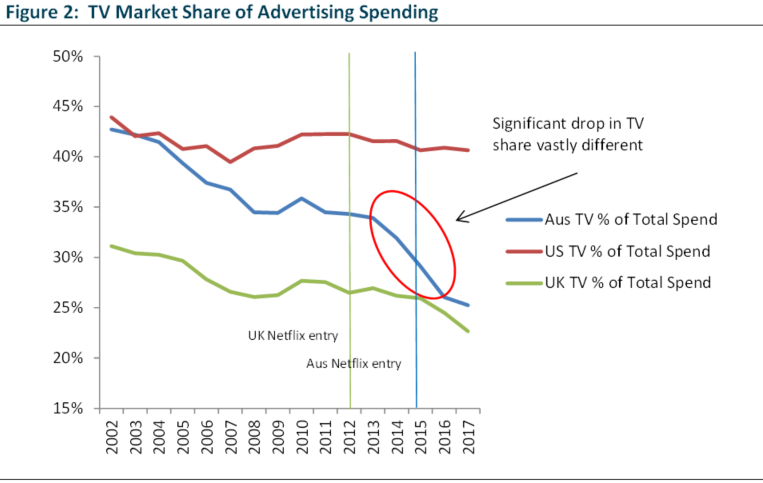 Source: Group M, Merlon Estimates That said, there is some evidence that media buying agencies have been incentivised to “over-index” to digital mediums. This issue has attracted a lot of attention in the US since 2010 and since then agencies have been subject to much more stringent audits of the way clients’ funds are disbursed. To understand the trajectory, it is worth recapping the evolution of digital marketing in Australia as this is poorly understood and the history is highly instructive in understanding the future trajectory. The Early Days of Digital Up until 2010, the majority of digital advertising sales between publishers and advertisers were no different to traditional media sales. Advertisers would approach media buyers who would buy inventory on their behalf adding value through leveraging their purchasing power to buy large blocks of advertising at discounted prices. A key issue with the model was the long tail of small publishers that media buyers were unable to access for their clients. This led to the creation of the first “ad networks” which allowed smaller publishers to pool inventory and access the market. Early on, mainstream publishers and their agencies had vested interests in dismissing ad networks as delivering ad impressions that were less effective and less transparent than traditional mediums. This has meant that for many years mainstream publishers were able to achieve prices for their inventory well above what might otherwise have been the case. The Rise of Real Time Bidding At the same time, the rapid growth and enormous success of search engine marketing was driving a push for increased transparency and effectiveness across all mediums. Search advertisers were able to specifically target outcomes whereas display advertisers appeared quite non-selective and haphazard by comparison. More advertising was being transacted through Real-Time Bidding (RTB) methods and so campaigns needed to be adjusted in real time rather than annually or quarterly. 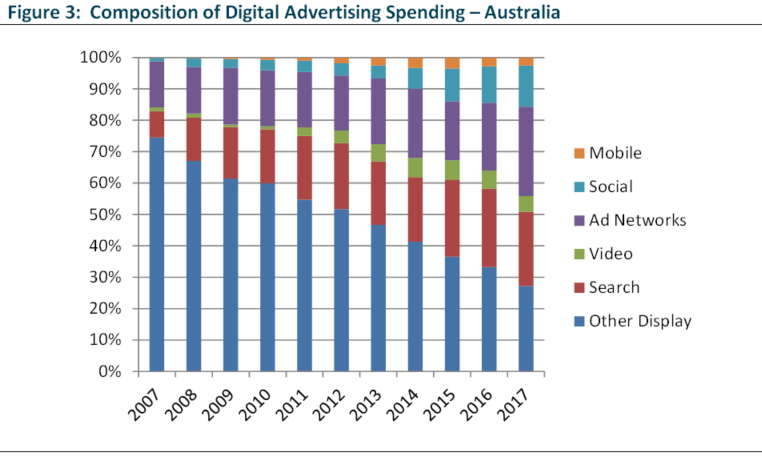 Source: SMI, Merlon Analysis The Rise of “Ad Networks” & Incentives to Overweight Digital As discussed earlier, mainstream publishers and their agencies initially had vested interests in dismissing ad networks as delivering ad impressions that were less effective and less transparent than traditional mediums. However, as time went on large publishers began to embrace ad networks as a means to monetising excess inventory. At the same time, more sophisticated advertisers were benefiting from shifting spend away from mainstream publishers. When compared to traditional media buying fees, ad networks were earning very high margins. Major agency holding companies sought to capture a portion of that margin for themselves and their clients by establishing “trading desks”. 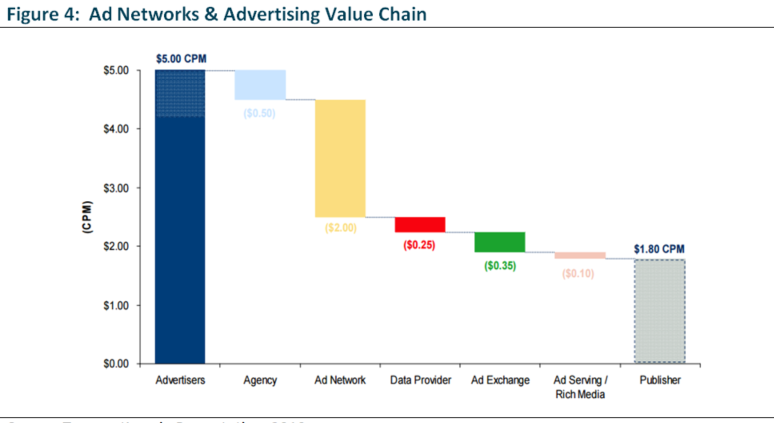 Source: Terence Kawaja Presentation, 2010 While the specific business models vary, there are a number of common features of agency trading desks and approaches to marking up other products and services that make them very different from the way media buying agencies have traditionally operated. 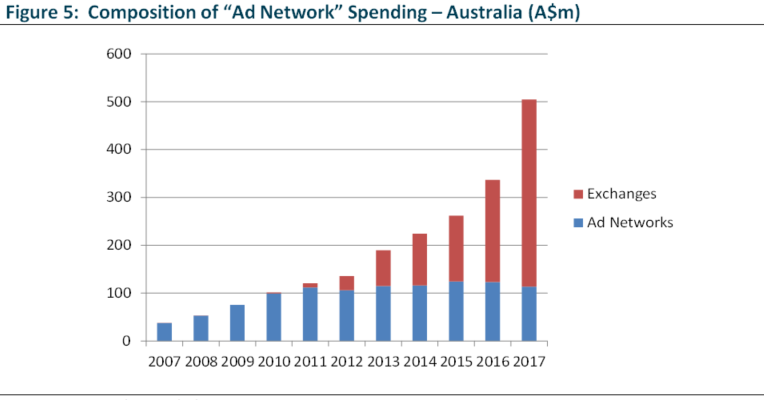 Source: SMI, Merlon Analysis Instead of buying on behalf of clients as they have historically done, through agency trading desks, media buyers are now buying as principals and then repacking and selling “product” to clients. The result is reduced transparency for clients. In some cases, agencies can profit from the spread between their cost price and what they resell to their clients even without bearing significant risk. In the US, this is referred to as “media arbitrage”. The practice of buying ahead of clients and on-selling marked up media inventory to them is akin to stockbrokers “front-running” clients in the share market, the latter of which is illegal in most countries. In US and Europe, this concern over transparency and arbitrage has been rising since 2014 and has contributed to reductions in the growth of arbitrage “pass-through” revenue reported by global agencies. For now, Australian companies seem less focused on enforcing transparency requirements with “trading-desk” spend continuing to expand over the same period. (See Figure 5). 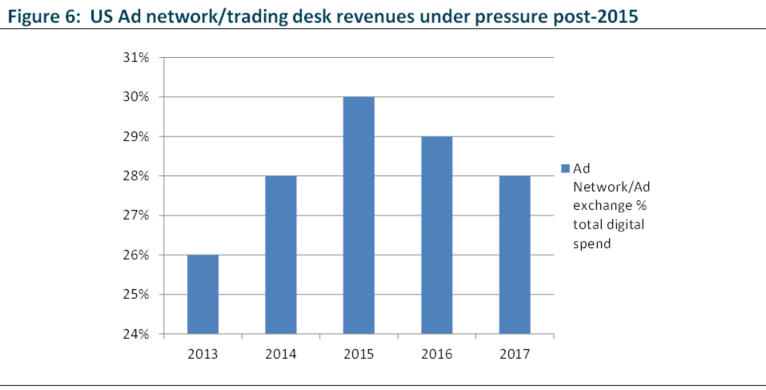 Source: SMI, Merlon Analysis Regardless of whether these revenue models represent good value for advertisers, the reality is agencies (or their holding companies) have a financial interest in certain outcomes (i.e. more digital display advertising) and these interests are not always fully disclosed and understood by all clients. A pull-back from short termism? We agree that headline ROI and targeted reach of digital is an attractive proposition. However, we believe the effectiveness of overall marketing spend is still dependent on an allocation across mediums to meet both short and long term goals. We also think some features of the agency model have led to over indexation of digital. Where linear television’s share matures long term is debatable but we think it would be foolish to assume free-to-air television has zero relevance in the “digital age” and equally foolish to assume free-to-air businesses cannot adapt to the digital environment. Simplistically, marketing activity can be divided into two components:
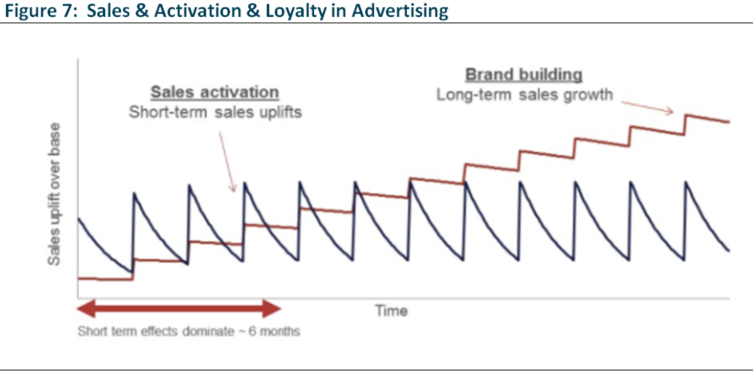 Source: Effectiveness in the digital era. 2016, Binet & Field IPA As marketing budgets get tighter (and CEO tenures shorter), there is an incentive for companies to reduce brand building spend in favour of sales activation via digital marketing. This strategy can provide short-term sales uplift and strong ‘return on investment’ but doesn’t do much in terms of brand building, acquisition of future customers and building a platform for sustainable growth. Given Merlon’s focus on assessing sustainable free-cash-flow, we play close attention to both the level and composition of marketing expenditure. There are many examples of companies that have under-invested in brand marketing only to find themselves struggling for growth and then (often under a new CEO) “resetting” budgets at much higher levels. Added to potential under-investment in brand are the increasingly conflicted business models of agency “partners” who are incentivised to over allocate spending to packaged digital “products” rather than simply negotiate the best possible deals with publishers as has historically been the case. Research and industry feedback rates television as the best medium for brand building due to its mass appeal and the degree of trust relative to digital content. Brand building requires a broad reach which has traditionally been the key advantage of television and newspapers. With newspaper readership declining at an even faster pace, TV remains the last medium with mass market reach available to advertisers. TV best in class adjusted ROI On top of the increasingly opaque pricing of digital advertising, concerns about effectiveness have also been raised, specifically the difficulty in assessing actual viewership and retention. Given the positioning of digital display around content, it is difficult to track whether eyeballs actually view advertising and whether this translates to real audience outcomes. By sharing “pixel coverage” on the screen with other content this can reduce the effectiveness of digital display advertising compared to television which commands 100% of pixels during an advertisement. “Independent” research by Ebiquity measured the impact of TV over 3 years compared to other media mediums. It found that TV is best in class for ROI by measuring actual sales instead of hypothetical customer reach per dollar spend. Of note, online display is the worst medium despite agency “exchanges” being most active in this category at present. 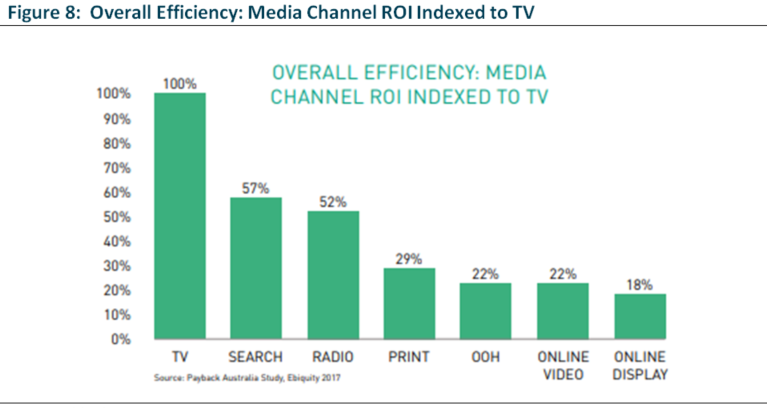 Source: Ebiquity The study also found that TV continues to influence customers post-campaign for the longest length of time relative to other mediums. 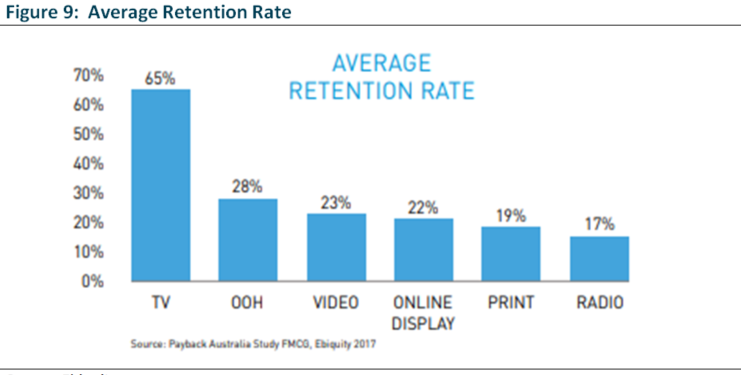 Source: Ebiquity We are well aware that funding for the Ebiquity study is provided by ThinkTV who are in turn supported by Australia’s free-to-air TV networks. ThinkTV provide research and data on television’s effectiveness as an advertising medium. However, there are studies in other countries which have yielded broadly similar results. While the measurement of “ROI” is often a subjective exercise, it is clear the past perception of TV’s ROI has been significantly poorer than reality and the release of the Ebiquity statistics are supportive of improving sentiment. Signs of improvement Contrary to general market perception, free-to-air television’s share of ad spending has stabilised and grown in the past 12 months. This stabilisation may be associated with the provision of data and research by ThinkTV, which commenced in May 2016. This helps marketing departments and advertising agencies justify a reallocation of funding towards TV using evidence based metrics. 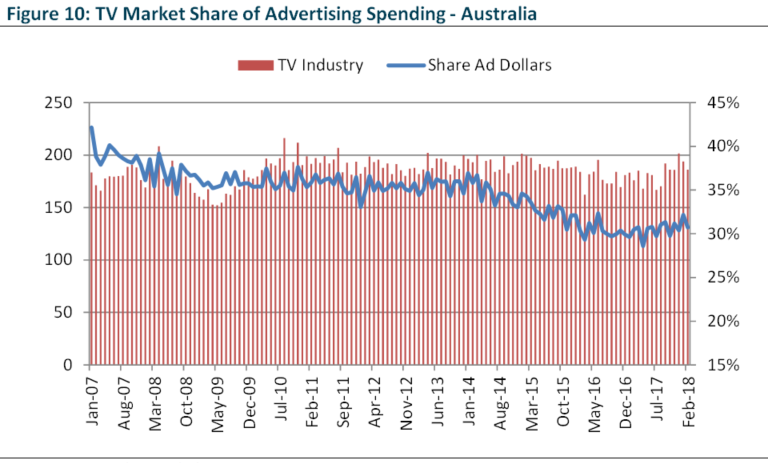 Source: SMI, Merlon Analysis We also believe that companies, both locally and globally are becoming more skeptical about how their digital dollars are being spent and the lack of transparency in agency pricing models. Based on our research, Australia is behind other markets from this perspective. Further, both locally and globally, advertisers are beginning to see the impact of the over-allocation to digital on their brand strength and longer term sales trends. Global consumer corporations, Unilever and Procter & Gamble, have been vocal in their reduction of digital marketing due to lack of transparency and effective delivery. Increasing issues around customer data privacy and potential brand damage from uncontrolled content are creating concern amongst both brand owners and customers. At the same time, television networks have not remained stagnant in the face of digital platform competition. They have reduced costs and debt, and have invested in digital BVOD (broadcaster video-on-demand) to meet the changing preferences of their audiences. There is enormous opportunity for free-to-air players to increase the rates they charge if the can more actively target particular audiences. Sports Rights Need to Share in Structural Decline Australian free to air television companies benefit greatly from anti-siphoning legislation of major sporting events that effectively shuts out subscription businesses such as Foxtel and Netflix from bidding for sporting events of ‘national interest’. For years we have struggled with the game theory of why free-to-air broadcasters compete so hard for sports rights given that they operate under this umbrella of protection. Given Channel Ten’s lower audience share, Channel Seven’s AFL and debt commitments and general commentary from the various players, we had expected a more rational approach to bidding for sports rights. To this end, we have been somewhat dismayed by Channel Nine bidding 50% more than Channel Seven’s previous bid for the Australian Open and will continue to test our theory of rational competitive behaviour. Ratings Remain Difficult to Predict We remain cautious about trying to forecast TV ratings which are the primary driver revenue share. While we believe there is a degree of mean regression in ratings over time, it remains difficult to forecast future audience preferences and each networks ability to cater for these preferences in an economical manner. On an individual stock basis, the potential for a permanent fall in ratings share contributes to each stock’s downside risk but at a portfolio level this is a zero sum game. Other constraints such as financial leverage can limit TV players from competing for quality content to help driving ratings. These have impacted both Nine and Ten in recent years and present pose a risk to Seven who hold $725m of net debt. 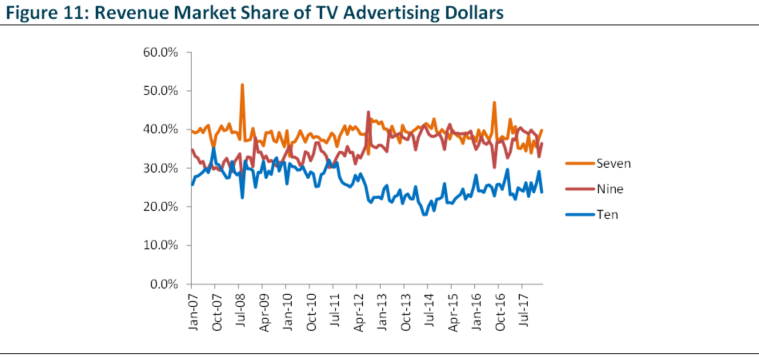 Source: SMI, Merlon Analysis Listed Company Valuations Reflect Very Low Expectations Nevertheless, we believe that the improvement in data and potential upside from positive industry developments are underappreciated by stock market investors. The spread in TV stock EV/EBITDA’s relative to the overall share market remains wide and is even wider when we consider these businesses’ relatively high conversion of EBITDA to free-cash-flow, our preferred measure of value. 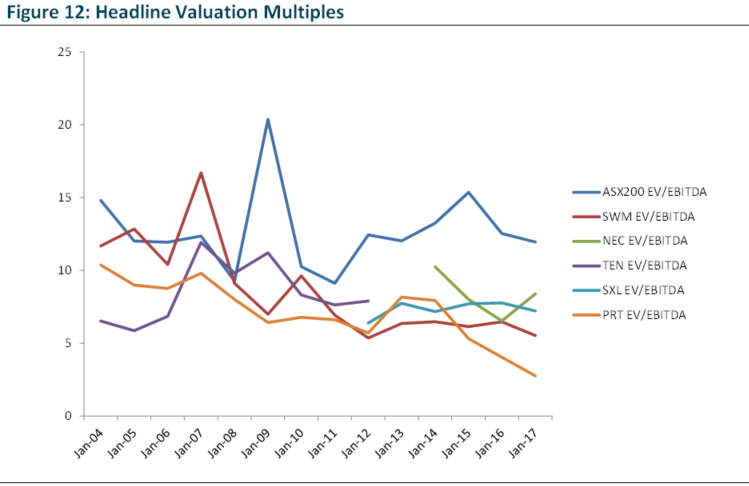 Source: Bloomberg, Merlon Analysis Given the poor momentum of television in recent years and the ongoing headwind from digital mediums, it is easy for the market to hold a negative view of the sector. Fund positioning We acknowledge it is uncertain whether TV’s share of advertising spending represents a cyclical pullback or a permanent stabilisation. However, we believe there are some underlying drivers at play that could tilt advertisers back to the medium. The flight of advertising dollars from Australian TV has been significantly more exuberant relative to other developed markets and agencies have continued to gouge on “packaged” digital products while their offshore counterparts have pulled back due to customer backlash. As such, we think there is some likelihood the rate of decline moderates. TV operators are actively defending their medium via evidence-based research which looks to be positive in recent advertising spend share metrics. Uncertainty can offer opportunity as many in the market are unwilling to invest in companies with perceived structural challenges. We believe that at current prices, expectations for further declines are more than priced in for television stocks that are trading at a significant discounts to even the most bearish valuation scenarios. Our base case valuations indicate material upside after factoring in further declines. Furthermore the television sector continues to generate strong, fully franked, free cash flow which is very attractive relative to the broader market. In addition, we believe the shift back towards long term brand building provides an asymmetric skew to further upside. 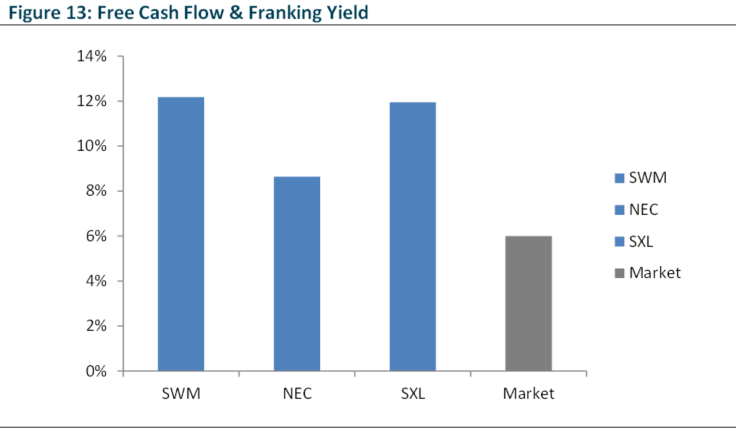 Source: Bloomberg, Merlon Analysis, Undiscounted sustainable free cash flow and franking estimate divided by current market value plus projected net debt Each TV stock offers an attractive risk/reward, but we think it is additionally prudent to own a mix of them, given the uncertainty around future ratings, debt levels and sports content cost management.
Merlon holds positions in Nine Entertainment Corporation, Seven West Media and Southern Cross Media.
1 Comment
Malcolm Spry
29/5/2018 04:12:56 pm
Hi Joey, Your comment will be posted after it is approved.
Leave a Reply. |
Markets & CommentaryAt TAMIM we are committed to educating investors on how best to manage their retirement futures. Sign up to receive our weekly newsletter:
TAMIM Asset Management provides general information to help you understand our investment approach. Any financial information we provide is not advice, has not considered your personal circumstances and may not be suitable for you.
Archives
April 2024
Categories
All
|
 RSS Feed
TAMIM | Equities | Property | Credit
DISCLAIMER
The information provided on this website should not be considered financial or investment advice and is general information intended only for wholesale clients ( as defined in the Corporations Act). If you are not a wholesale client, you should exit the website. The content has been prepared without taking into account your personal objectives, financial situations or needs. You should seek personal financial advice before making any financial or investment decisions. Where the website refers to a particular financial product, you should obtain a copy of the relevant product services guide or offer document for wholesale investors before making any decision in relation to the product. Investment returns are not guaranteed as all investments carry some risk. The value of an investment may rise or fall with the changes in the market. Past performance is no guarantee of future performance. This statement relates to any claims made regarding past performance of any Tamim (or associated companies) products. Tamim does not guarantee the accuracy of any information in this website, including information provided by third parties. Information can change without notice and Tamim will endeavour to update this website as soon as practicable after changes. Tamim Funds Management Pty Limited and CTSP Funds Management Pty Ltd trading as Tamim Asset Management and its related entities do not accept responsibility for any inaccuracy or any actions taken in reliance upon this advice. All information provided on this website is correct at the time of writing and is subject to change due to changes in legislation. Please contact Tamim if you wish to confirm the currency of any information on the website.
magellen, kosec, clime, wilson, wam, montgomery, platinum, commsec, caledonia, pengana, tamim